USD: Sept '24 is Up at 103.975.

Energies: Aug '24 Crude is Down at 80.94.

Financials: The Sept '24 30 Year T-Bond is Up 23 ticks and trading at 119.29

Indices: The Sept '24 S&P 500 emini ES contract is 30 ticks Higher and trading at 5690.50.

Gold: The Aug'24 Gold contract is trading Up at 2444.70.

Initial conclusion

This is not a correlated market.  The USD is Up and Crude is Down which is normal, and the 30 Year T-Bond is trading Up.  The Financials should always correlate with the US dollar such that if the dollar is Higher, then the bonds should follow and vice-versa. The S&P is Higher and Crude is trading Lower which is correlated. Gold is trading Higher which is not correlated with the US dollar trading Up.  I tend to believe that Gold has an inverse relationship with the US Dollar as when the US Dollar is down, Gold tends to rise in value and vice-versa. Think of it as a seesaw, when one is up the other should be down. I point this out to you to make you aware that when we don't have a correlated market, it means something is wrong. As traders you need to be aware of this and proceed with your eyes wide open.  Asia traded Mixed. Currently all of Europe is trading Lower. 

Possible challenges to traders

  • Core Retail Sales m/m is out at 8:30 AM EST.  This is Major.

  • Retail Sales m/m is out at 8:30 EST.  This is Major.

  • Import Prices m/m are out at 8:30 AM EST.  This is not Major.

  • Business Inventories m/m is out at 10 AM EST.

  • NAHB Housing Market Index is out at 8:30 AM EST.

  • FOMC Member Kugler Speaks at 2:45 PM EST.

Traders, please note that we've changed the Bond instrument from the 10 year (ZN) to the 2 year (ZT). They work exactly the same.  

We've elected to switch gears a bit and show correlation between the 10-year Treasury notes (ZN) and the S&P futures contract.  The YM contract is the Dow Jones Industrial Average, and the purpose is to show reverse correlation between the two instruments.  Remember it's likened to a seesaw, when up goes up the other should go down and vice versa.  

Yesterday the ZT migrated Higher at around 8:30 AM EST after the economic news was released.  If you look at the charts below the ZT gave a signal at around 8:30 AM and started its Upward climb.  Look at the charts below and you'll see a pattern for both assets. The Dow moved Lower at 8:30 AM and the ZT moved Higher at around the same time.  These charts represent the newest version of BarCharts and I've changed the timeframe to a 15-minute chart to display better.  This represented a Long opportunity on the 2-year note, as a trader you could have netted about 20 plus ticks per contract on this trade.   Each tick is worth $7.625.  Please note: the front month for ZT is Sept and the Dow is now Sept '24.  I've changed the format to filled Candlesticks (not hollow) such that it may be more apparent and visible.  

Charts courtesy of barcharts

ZT

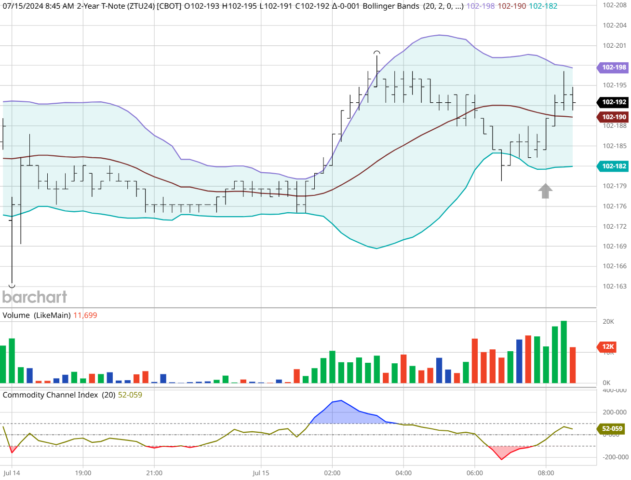
ZT -Sept 2024 - 07/15/24

Dow

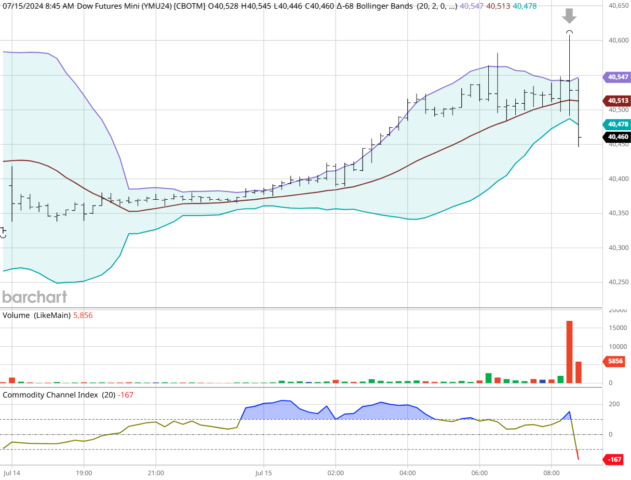
Dow - Sept 2024 - 07/15/24

Bias

Yesterday we gave the markets an Upside bias and the indices didn't disappoint.  The Dow rose by 211 points and the other indices closed Higher as well. Today we aren't dealing with a correlated market and our bias is Neutral or Mixed.

Could this change? Of Course. Remember anything can happen in a volatile market. 

Commentary

Over the weekend with the attempted assignation on Donald Trump, the Internet is alive with rumors and falsehoods on how it happened.  All of course with no truth or proof behind them.  Our take?  The markets move HIgher when people (traders) make them move Higher.  Yesterday saw a more normal market than we've seen in quite a while.  Today we have Retail Sales, Core Retail Sales, NAHB Housing Market Index.  Will this keep the momentum going?  As in all things, only time will tell.

Trading performance displayed herein is hypothetical. The following Commodity Futures Trading Commission (CFTC) disclaimer should be noted.

Hypothetical performance results have many inherent limitations, some of which are described below. No representation is being made that any account will or is likely to achieve profits or losses similar to those shown.

In fact, there are frequently sharp differences between hypothetical performance results and the actual results subsequently achieved by any particular trading program. One of the limitations of hypothetical performance trading results is that they are generally prepared with the benefit of hindsight.

In addition, hypothetical trading does not involve financial risk, and no hypothetical trading record can completely account for the impact of financial risk in actual trading. For example, the ability to withstand losses or to adhere to a particular trading program in spite of trading losses are material points which can also adversely affect actual trading results.

There are numerous other factors related to the markets in general or to the implementation of any specific trading program which cannot be fully accounted for in the preparation of hypothetical performance results and all of which can adversely affect actual trading results.

Trading in the commodities markets involves substantial risk and YOU CAN LOSE A LOT OF MONEY, and thus is not appropriate for everyone. You should carefully consider your financial condition before trading in these markets, and only risk capital should be used.

In addition, these markets are often liquid, making it difficult to execute orders at desired prices. Also, during periods of extreme volatility, trading in these markets may be halted due to so-called “circuit breakers” put in place by the CME to alleviate such volatility. In the event of a trading halt, it may be difficult or impossible to exit a losing position.

Recommended Content


Recommended Content

Editors’ Picks

EUR/USD retreats below 1.0900 after US data

EUR/USD retreats below 1.0900 after US data

EUR/USD stays under modest bearish pressure and trades below 1.0900 in the second half of the day on Tuesday. The US Dollar holds its ground following the Retail Sales data for June, making it difficult for the pair to regain its traction.

EUR/USD News

GBP/USD loses traction, drops to 1.2950 area

GBP/USD loses traction, drops to 1.2950 area

GBP/USD struggles to keep its footing and trades in negative territory at around 1.2950 in the American session. June Retail Sales data from the US helps the US Dollar stay resilient against its rivals, not allowing the pair to build on previous week's gains.

GBP/USD News

Gold pulls away from multi-week highs, holds above $2,430

Gold pulls away from multi-week highs, holds above $2,430

Gold edges slightly lower from the multi-week high it set above $2,440 but stays in positive territory above $2,430 on Tuesday. The benchmark 10-year US Treasury bond yield recovers above 4.2% after US data following earlier drop, capping XAU/USD's upside.

Gold News

Bitcoin price consolidates near $62,000 despite liquidation of $71.02 million in short position and surge in Open Interest

Bitcoin price consolidates near $62,000 despite liquidation of $71.02 million in short position and surge in Open Interest

Bitcoin (BTC) sees a 3% price decline on Tuesday, trading around the $63,000 level at the time of writing. On-chain data shows a liquidation of $71.02 million in short positions and a rise in open interest. 

Read more

ECB bank lending survey shows only modest pickup in expected loan demand

ECB bank lending survey shows only modest pickup in expected loan demand

While the economy has returned to growth and interest rates are coming down, loan demand is only modestly improving as bank credit standards remain tight. For the ECB, there is nothing in the data that moves the needle for coming rate cuts.

Read more

Majors

Cryptocurrencies

Signatures