The UK’s improving inflation outlook in six charts
Last summer, investors thought the UK’s inflation problem was uniquely bad. Fast forward to today and headline inflation will soon be below target and the Bank of England should have enough evidence of disinflation to be able to cut rates in August.
Headline inflation should fall back on Wednesday
This Wednesday we’ll get the latest UK inflation figures, and the Bank of England will want to see confirmation that services inflation is starting to come down, as widely anticipated.
That data, which we expect to drop to 6.0% from 6.5% in January, is perhaps the single most important indicator for determining the timing of the first rate cut. Policymakers have signalled they need to see progress on this and private-sector wage growth before acting. This Thursday's meeting looks too early for any further hints on the timing of that first cut.
But for investors, there’s a wider question of where the UK sits relative to its global peers. Last summer, there was a strong conviction in the investment community that the UK’s inflation problem was uniquely bad. At the time US and eurozone inflation had started to see swift disinflation where Britain had not. In investors' minds, that inflation challenge would require a much more decisive BoE response. At one point, markets were pricing UK rates a full two percentage points higher in two years' time than in the US.
How UK rate expectations two years ahead compare to the US
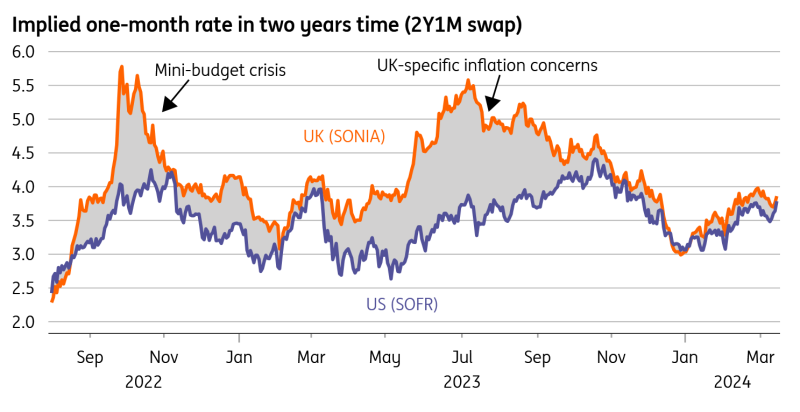
Source: Macrobond, ING
That narrative has now virtually disappeared. The chart above shows that the spread between UK and US medium-term rate expectations has narrowed considerably since last summer. Investors now expect roughly three rate cuts in both the UK and US this year. We think that synchronisation recognises that the UK inflation story has simply been lagging behind what’s happened elsewhere in the eurozone, as the chart below shows.
How UK and eurozone inflation compares
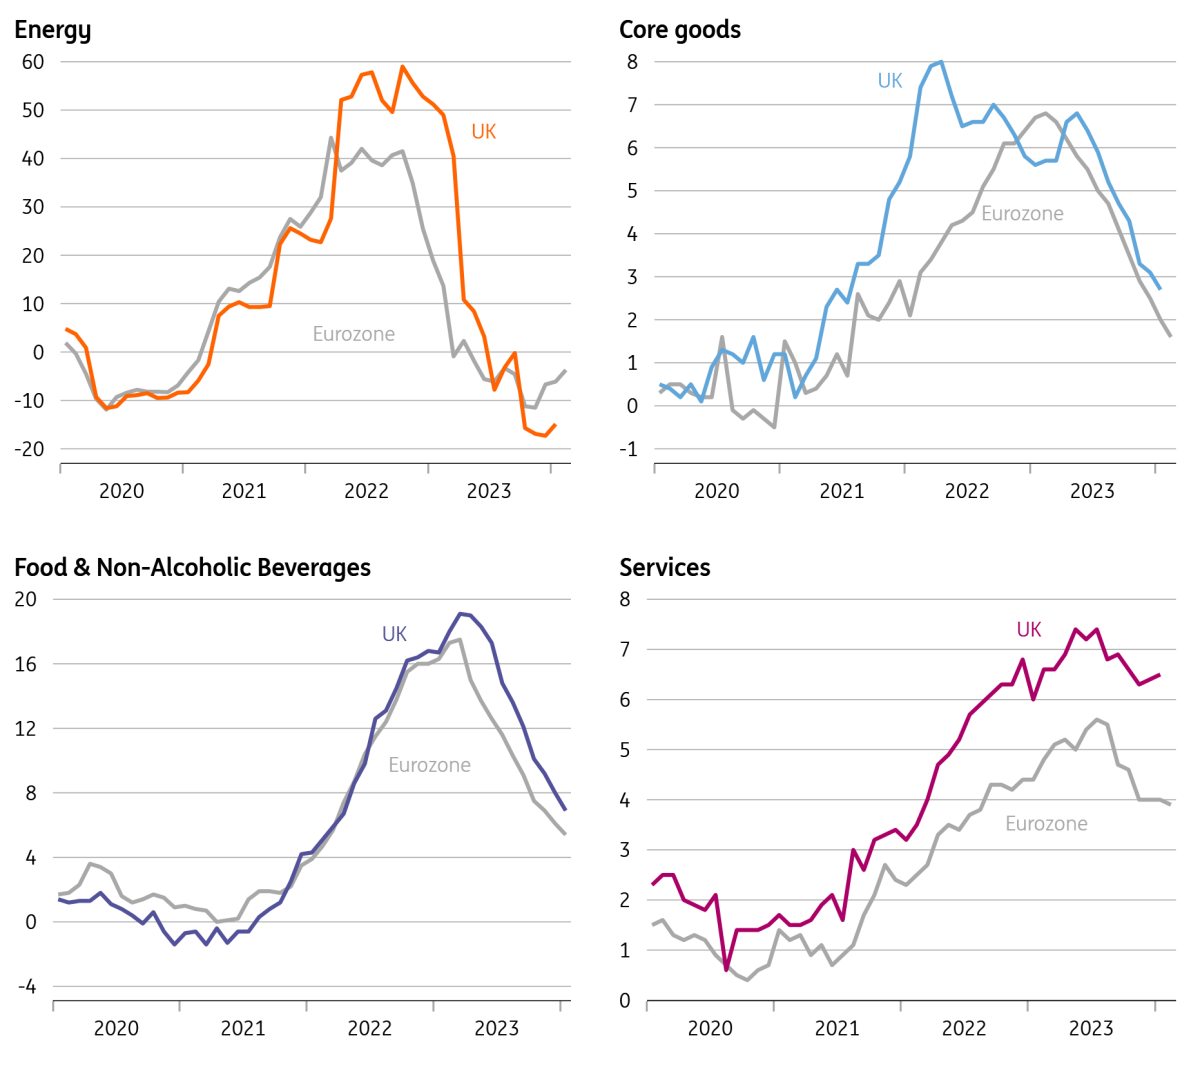
Source: Macrobond
The most obvious impact of that lag is on energy, where the effect of lower wholesale natural gas prices has taken a little longer to come through in Britain. That's down to the way the regulated price cap works in the UK. Ofgem, the energy regulator, has already announced that the average household electricity/gas bill will fall by 12% in April and judging by the recent fall in wholesale prices, it looks like we could see another decent decline in July, too (the price cap is adjusted each quarter).
Falling wholesale gas prices point to lower household bills in July
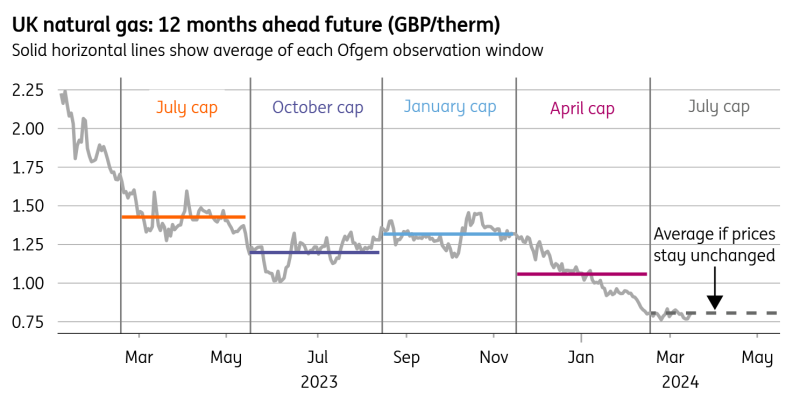
Source: Macrobond, ING calculations
Note: This is a simplification of the Ofgem methodology, which takes into account gas futures prices but also a range of other factors.
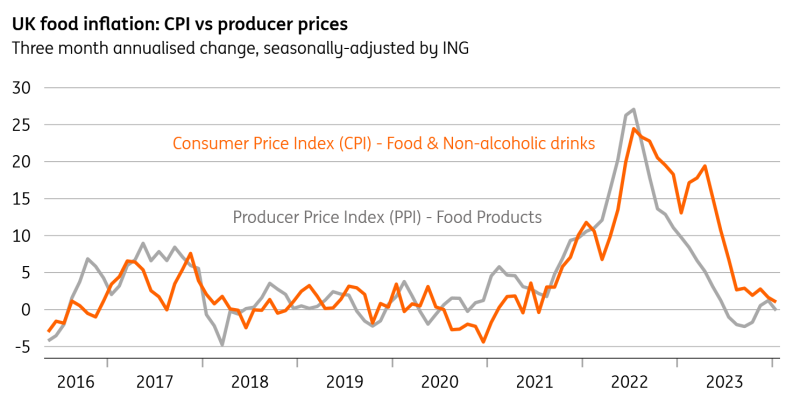
Food inflation should fall back rapidly
It's a similarly lagged story when it comes to food. The UK saw a later and slightly higher peak in food inflation, but otherwise the trend is similar. In fact, we think that the annual rate of food inflation, currently 7%, will fall below 1% in June or July.
If we look at recent month-on-month changes in producer price inflation, this has been flat to slightly negative for several months now and we’ve started to see the same thing in the monthly consumer food price numbers too. In other words, the elevated level of annual food inflation is almost entirely down to base effects at this point and these will fall away pretty quickly through the first half of this year.
On a month-on-month basis, food inflation is easing rapidly
Source: Macrobond, ING
Headline inflation should fall below 2% in April or May
The result is that headline UK inflation, currently 4%, is set to fall to 3.5% in this week’s data. We then expect April’s fall in energy prices to drag headline CPI below 2% - and it’s a bit of a coin toss as to whether this happens in April or May.
That uncertainty – and it isn’t hugely consequential – is down to the latest annual update to the weights of the inflation basket, which slightly bolster the relevance of services relative to goods. Given the inflation rate of the former is higher than the latter, the result is a slightly higher near-term inflation profile. Ultimately though, we expect headline inflation to stay below target for much of 2024.
ING forecasts for UK inflation
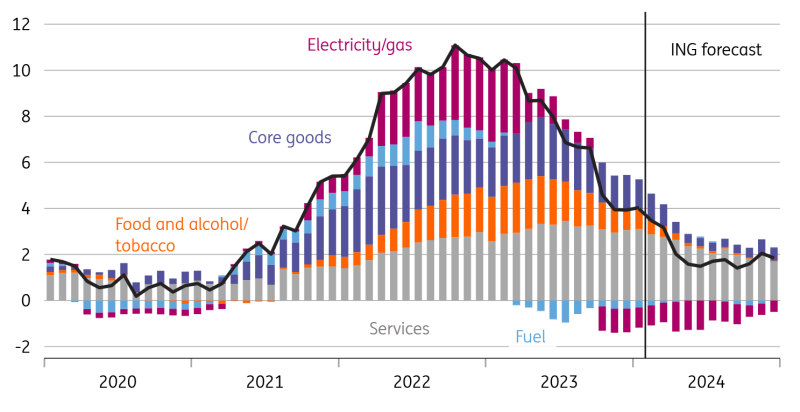
Source: Macrobond, ING forecasts
Services inflation should fall further in the second quarter
For the Bank of England, though, it comes back to services inflation, which has been proving stickier than in other parts of Europe.
Some of this differential can be linked to factors not entirely explained by economics, and the obvious example here is communication prices (things like internet/phone bills). UK communications inflation is currently at 8.2%, whereas the eurozone is -1.2%, which we think can only be explained by technical or methodological differences. Some of the difference is also linked to rents, where the UK has seen more aggressive price growth than elsewhere, perhaps owing to differences in rent controls. There are finally signs that rental inflation might be starting to ease, but it’s early days.
There are pockets good news though and one of them is catering, a key part of the services inflation basket. This has followed a similar downward trend to the eurozone, and we think some of this disinflation can be traced back to the impact of lower energy bills for small business owners.
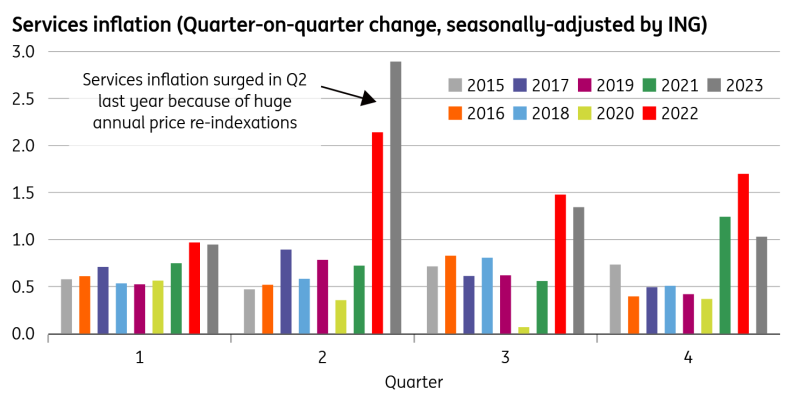
UK services inflation surged in Q2 last year
Source: Macrobond, ING analysis
More broadly, we think the second quarter will be crucial for services inflation.
Last year we saw very aggressive service-sector price rises through April and May, much of which was seemingly linked to annual contractual or index-linked increases, themselves tied to prior rates of headline inflation. The most obvious example is telecoms, where it’s not uncommon to see CPI + 4% annual increases. Logic dictates that this year’s price rises should be less aggressive, given that the headline inflation rates these hikes are based on are much lower than a year earlier. But we don’t think the Bank of England will want to second guess this and will want to see the hard data for April and May before deciding what to do next.
We suspect that leaves June as the earliest date for a rate cut, but more likely we think the Bank will wait until August. At that point it’ll have another month of data, plus a new set of forecasts available. We expect four rate cuts in total this year.
Read the original analysis: The UK’s improving inflation outlook in six charts
Author

ING Global Economics Team
ING Economic and Financial Analysis
From Trump to trade, FX to Brexit, ING’s global economists have it covered. Go to ING.com/THINK to stay a step ahead.


