|

The three benchmark US indices

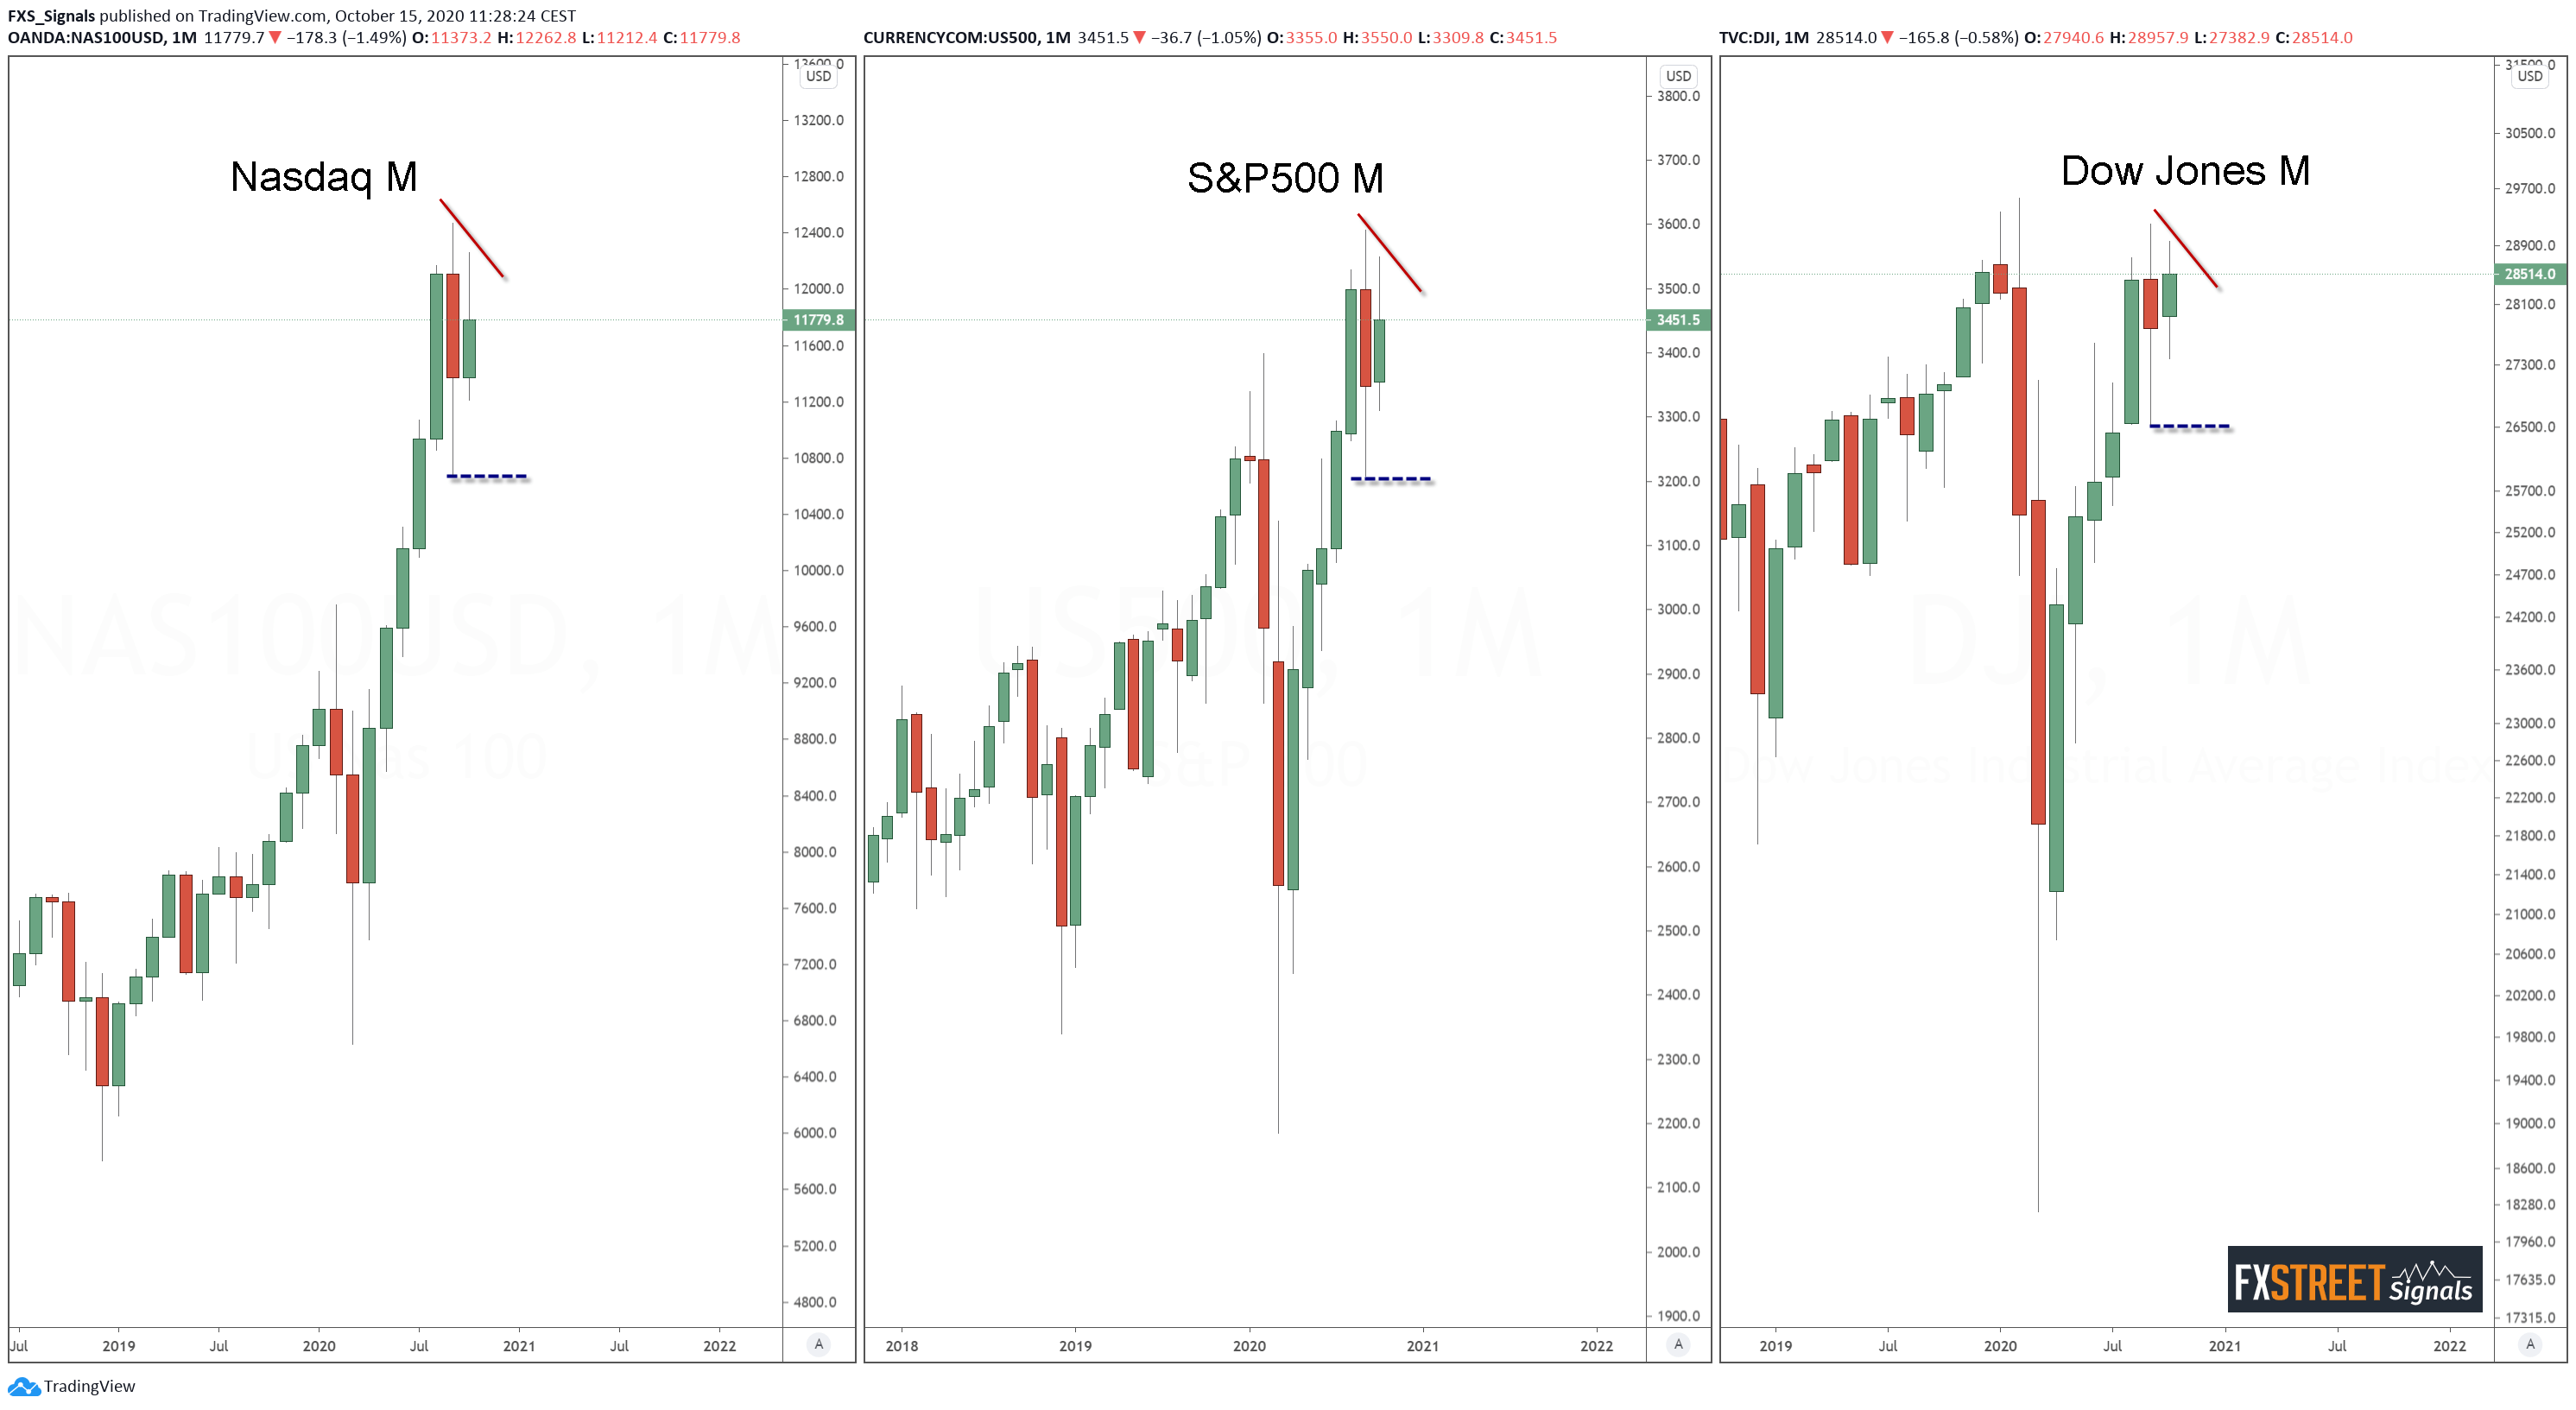
The three monthly charts depicting the US benchmark indices merits repeating again (we published a similar chart two weeks ago in the FXStreet Signals group) in order to gain a long-term perspective for risk appetite. In our analysis at the beginning of October, the most outstanding signal on these charts were the Japanese reversal patterns emerging on monthly candles. 

Against our positioning, all indices recovered and failed to confirm the aforementioned patterns by breaking below the September lows. This means that we are still pending a confirmation which ideally should arrive at -or with- the Oct close. But so far, we can't speak of these patterns being invalidated either. All three indices failed to break above the September high. Remember, an invitation (or lack of confirmation) is a signal in itself. We don't have a signal for a continuation of the bull run either.

Looking at the global MSCI ACWI index, a global equity index set of large- and mid-cap stocks across 23 developed and 26 emerging markets (not shown in this chart) the same message comes across. An offsetting signal, on the other hand, arrives from the Russel 2000, which did violate the September high last week, but meanwhile, it has lost almost 50% of those gains.

We are repeating these updated charts for the benefit of new readers, but also for all of you who have endured JPY longs in the last two weeks, with the detriment of your equities. 

For more info on the FXStreet Signals service click here.

Author

Gonçalo Moreira, CMT

Gonçalo Moreira, CMT

Independent Analyst

As a trader in the foreign exchange market since 2005, Gonçalo Moreira honed his analytic and strategic skills through the Chartered Market Technician (CMT) designation. 

More from Gonçalo Moreira, CMT
Share:

Editor's Picks

EUR/USD hits two-day highs near 1.1820

EUR/USD picks up pace and reaches two-day tops around 1.1820 at the end of the week. The pair’s move higher comes on the back of renewed weakness in the US Dollar amid growing talk that the Fed could deliver an interest rate cut as early as March. On the docket, the flash US Consumer Sentiment improves to 57.3 in February.

GBP/USD reclaims 1.3600 and above

GBP/USD reverses two straight days of losses, surpassing the key 1.3600 yardstick on Friday. Cable’s rebound comes as the Greenback slips away from two-week highs in response to some profit-taking mood and speculation of Fed rate cuts. In addition, hawkish comments from the BoE’s Pill are also collaborating with the quid’s improvement.

Gold climbs further, focus is back to 45,000

Gold regains upside traction and surpasses the $4,900 mark per troy ounce at the end of the week, shifting its attention to the critical $5,000 region. The move reflects a shift in risk sentiment, driving flows back towards traditional safe haven assets and supporting the yellow metal.

Crypto Today: Bitcoin, Ethereum, XRP rebound amid risk-off, $2.6 billion liquidation wave

Bitcoin edges up above $65,000 at the time of writing on Friday, as dust from the recent macro-triggered sell-off settles. The leading altcoin, Ethereum, hovers above $1,900, but resistance at $2,000 caps the upside. Meanwhile, Ripple has recorded the largest intraday jump among the three assets, up over 10% to $1.35.

Three scenarios for Japanese Yen ahead of snap election

The latest polls point to a dominant win for the ruling bloc at the upcoming Japanese snap election. The larger Sanae Takaichi’s mandate, the more investors fear faster implementation of tax cuts and spending plans. 

XRP rally extends as modest ETF inflows support recovery

Ripple is accelerating its recovery, trading above $1.36 at the time of writing on Friday, as investors adjust their positions following a turbulent week in the broader crypto market. The remittance token is up over 21% from its intraday low of $1.12.