The test of the S&P 500 bulls
Already at yesterday’s open, stocks have erased Tuesday’s downswing – and as the day progressed, more gains came in. S&P 500 finished at our initial upside target, at the 61.8% Fibonacci retracement. As the Fed press conference got underway, stocks attempted to break above this key resistance, but sold off in the final 15 minutes of the trading session. What comes most likely next?
Let’s check yesterday’s developments on the daily chart (charts courtesy of http://stockcharts.com ).
S&P 500 in the Short-Run
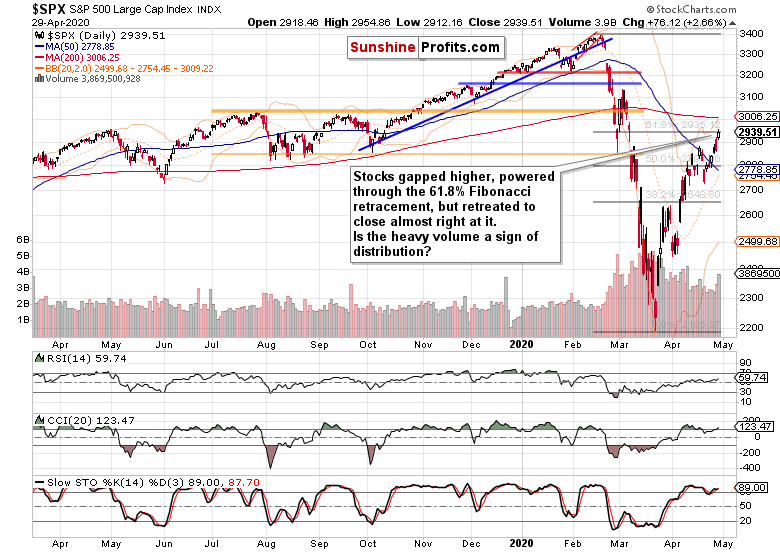
Yesterday’s candle shows the battle between the bulls and bears. The candle’s shape is bullish by itself, because the upper knot isn’t exactly dwarfing the white body. Therefore, the higher volume of yesterday’s upswing can be chalked down to meeting a serious technical obstacle rather than experiencing heavy selling into strength.
Please note that earlier in April, we’ve seen higher volume too, and stocks still made it above the key resistance (the 50% Fibonacci retracement) back then. The daily chart examination right now leans in favor of upcoming consolidation that will be followed by renewed upswing taking on the upper border of the early March bearish gap.
Let’s explore the clues that favor exactly this outcome.
The Credit Markets’ Point of View
We’ll open this section with the high yield corporate bonds (HYG ETF) analysis.
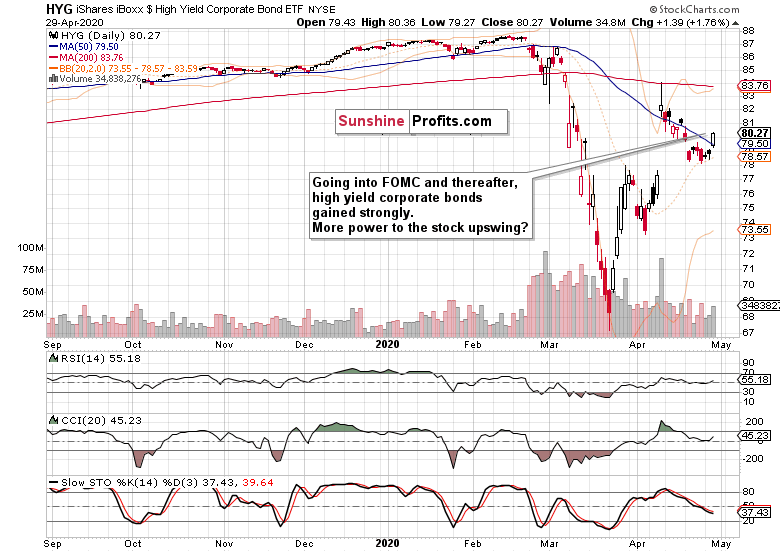
It’s not just yesterday’s strong showing of corporate junk bonds, their ratio to short-term Treasuries (SHY ETF) performed similarly well. Primed for more gains, they are not alone in this position.
The investment grade corporate bonds to longer-dated Treasuries ratio (LQD:IEI) also moved to the upside yesterday, and appears ready to break higher out of its bullish flag. This is true despite both LQD ETF lagging behind the HYG ETF yesterday, and the weaker showing of municipals (HYD ETF).
Key S&P 500 Sectors in Focus
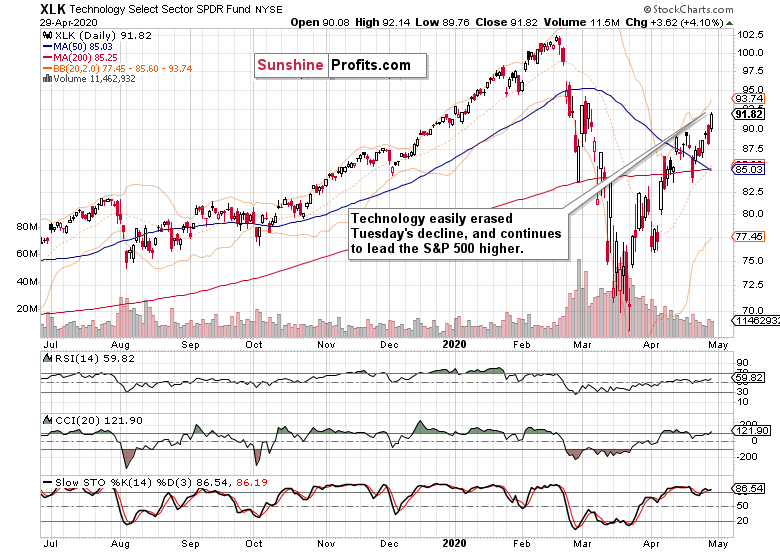
Technology continues to lead higher, erasing Tuesday’s setback in one go. Whether you look at Alphabet stocks class A or C (GOOGL, resp. GOOG), it’s predictably been a star performer of yesterday’s session. Microsoft (MSFT) and Facebook (FB) results also show that Big Tech can make it through the storm. How strong will Amazon (AMZN) earnings be when it reports today after the market close? In our opinion, the stock will push higher, confirming our bullish bias for the tech sector.

Healthcare recovered part of the lost ground, and appears to be in need of more time to consolidate before continuing higher. The volume of last two sessions is definitely more consistent with consolidation in the sector than with distribution.
But where would the engine of upcoming S&P 500 gains be? Energy (XLE ETF), materials (XLB ETF) and industrials (XLI ETF) have led the charge yesterday too. Consumer discretionaries (XLY ETF) have also smartly dealt with Tuesday’s setback, similarly to financials (XLF ETF).
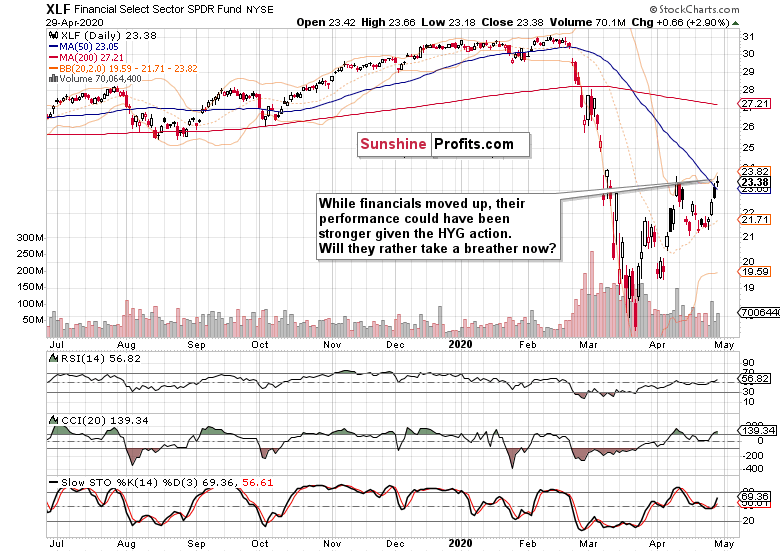
Given the strong performance in the credit markets, financials a bit surprisingly paused yesterday. It appears likely that similarly to healthcare, this sector needs to digest recent gains before the next move. And chances are, that the move would be higher when it arrives.
The Fundamental S&P 500 Outlook
Yesterday’s Fed meeting is over, and the not so subtle Fed hints that we won’t run out of money are there. So far, so good – the implicit Powell put is in. Despite today’s premarket downswing (futures trade at around 2910 currently) stocks don’t appear ready to test the resolve in what might very well turn out to be a bear trap.
Yes, weekly unemployment claims are just in, at almost 3850K – disappointing expectations. The economy reopening is a long process (state-by-state different) and isn’t likely to bring a V-shaped consumer rebound on a lasting basis. But stocks are forward-looking, ready to bridge the view of more than one quarter ahead.
We’ll monitor the anatomy of both the up and down days for signs that this upleg is over. Right now, that still doesn’t appear to be the case.
From the Readers’ Mailbag
Q: In your latest alert, you mentioned a profit target for the S&P 500, what's the exit strategy? To complicate matters a little more, we use your service to trade 3x ETFs, what would the stop-loss percentage be and of course, the exit profit target?
A: We didn’t exit the profitable long positions at the first rendezvous with the 61.8% Fibonacci retracement, because too many signs (credit markets, sectoral strength) point to the upswing consolidation. Sure, we’re experiencing a pullback today, but does it change the bullish short-term outlook? We’ll examine the sectors with their ratios and see whether our ducks remain as much lined up in a row as they were going into this session. And naturally, we’ll react and issue an intraday Stock Trading Alert if situation warrants that.
Thanks in no small part to the early March bearish gap, the 61.8% Fibonacci retracement offers a stronger resistance than the 50% Fibonacci resistance. And it took quite a few attempts to overcome this weaker resistance, which is why we expect that overcoming the 61.8% one wouldn’t be piece of cake either. We’ll monitor the tape and money trail thanks to the sizable upside potential in this trade – the next strong resistance zone is at the July and September highs (at around 3050).
Coming to the leveraged ETFs part of your question, please note that it really depends on their underlying assets (i.e. the ETF’s construction). Generally speaking, they are designed to magnify the intraday moves. If I were in your place, I would look at how the instrument performed during the recent upswings and downswings in the S&P 500 – did it roughly match the index move? That will serve as a useful guideline on where it’s sensible to place any kind of limit or market orders. If it hasn’t exactly matched that index move, a recalculation of what to reasonably expect from the instrument should the S&P 500 move to this or that level, is a sensible approach.
Finally, you’re asking about the stop-loss percentage. In the overview of Trade Results at the Performance page of my home site, you’ll see the percentage of account risked on each past trade. That’s a key building block in the money management, because it allows you to risk only as much as you are comfortable with in any trade. At the same time, we manage our open trades according to the prevailing outlook, which means that not every take-profit or stop-loss order has to be hit to take us out of the open position. Capital preservation is the rule number one. The offense wins matches, while the defense wins championships.
Summary
Summing up, S&P 500 challenged the 61.8% Fibonacci retracement yesterday, and today’s premarket trading shows that it won’t be that easily overcome. But the index still remains primed for further gains, and the credit markets keep on providing tailwinds. Powered by positive earnings reports, the tech sector looks far from having topped. While healthcare and financials are likely to consolidate, the stealth bull market trio (energy, materials and industrials) continues to perform. And so do consumer discretionaries. As the bulls’ resolve get tested and stocks digest recent gains, the balance of risks still remains skewed to the upside and our long position justified.
Want free follow-ups to the above article and details not available to 99%+ investors? Sign up to our free newsletter today!
Want free follow-ups to the above article and details not available to 99%+ investors? Sign up to our free newsletter today!
Author

Monica Kingsley
Monicakingsley
Monica Kingsley is a trader and financial analyst serving countless investors and traders since Feb 2020.


