The Taxman Cometh

USD: Jun '24 is Down at 105.690.
Energies: May '24 Crude is Down at 84.94.
Financials: The June '24 30 Year T-Bond is Down 34 ticks and trading at 115.15.
Indices: The Jun '24 S&P 500 emini ES contract is 88 ticks Higher and trading at 5189.50.
Gold: The Apr'24 Gold contract is trading Up at 2374.70.
Initial conclusion
This is not a correlated market. The USD is Down and Crude is Down which is not normal, and the 30 Year T-Bond is trading Lower. The Financials should always correlate with the US dollar such that if the dollar is Higher, then the bonds should follow and vice-versa. The S&P is Higher and Crude is trading Lower which is correlated. Gold is trading Higher which is correlated with the US dollar trading Up. I tend to believe that Gold has an inverse relationship with the US Dollar as when the US Dollar is down, Gold tends to rise in value and vice-versa. Think of it as a seesaw, when one is up the other should be down. I point this out to you to make you aware that when we don't have a correlated market, it means something is wrong. As traders you need to be aware of this and proceed with your eyes wide open. All of Asia is trading Lower with the exception of the Shanhai exchange which is Higher. Currently all of Europe is trading Higher with the exception of the London and Spanish IBEX exchanges.
Possible challenges to traders
-
Core Retail Sales m/m is out at 8:30 AM EST. This is Major.
-
Retail Sales is out at 8:30 AM EST. This is Major.
-
Wholesale Sales m/m is out at 8:30 AM EST. This is Major.
-
Empire State Manufacturing Index is out at 8:30 AM EST. This is Major.
-
FOMC Member Williams Speaks at 8:30 AM EST. This is Major.
-
Business Inventories m/m are out at 10 AM EST. This is Major.
-
NAHB Housing Market Index is out at 10 AM EST. This is Major.
Treasuries
Traders, please note that we've changed the Bond instrument from the 30 year (ZB) to the 10 year (ZN). They work exactly the same.
We've elected to switch gears a bit and show correlation between the 10-year bond (ZN) and the S&P futures contract. The S&P contract is the Standard and Poor's, and the purpose is to show reverse correlation between the two instruments. Remember it's likened to a seesaw, when up goes up the other should go down and vice versa.
On Friday the ZN migrated Higher at around 8:30 AM EST as the S&P hit a High at around the same time. If you look at the charts below the S&P gave a signal at around 8:30 AM and the ZN started its Upward climb. Look at the charts below and you'll see a pattern for both assets. S&P hit a High at around 8:30 AM and migrated Lower. These charts represent the newest version of MultiCharts and I've changed the timeframe to a 15-minute chart to display better. This represented a Long opportunity on the 10-year note, as a trader you could have netted about 20 ticks per contract on this trade. Each tick is worth $15.625. Please note: the front month for both the ZN and the S&P are now Jun '24. I've changed the format to filled Candlesticks (not hollow) such that it may be more apparent and visible.
Charts courtesy of MultiCharts built on an AMP platform
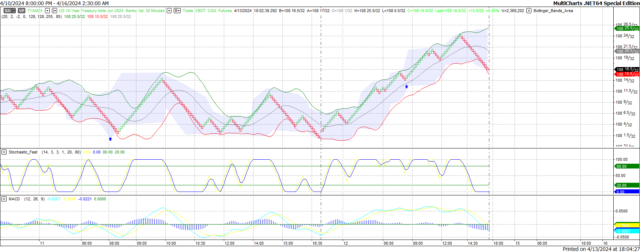
ZN -Jun 2024 - 04/12/24
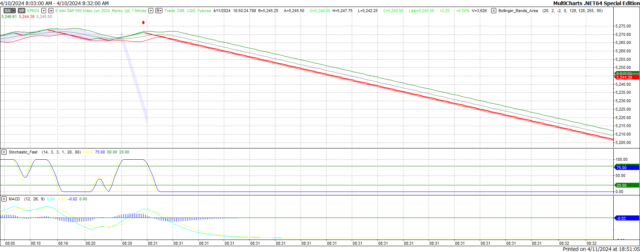
S&P - Jun 2024 - 04/12/24
Bias
On Friday we gave the markets a Neutral or Mixed bias. The markets had other ideas and dropped dramatically. The Dow lost 476 points and the other indices lost ground as well. Today we aren't dealing with a correlated market and our bias is to the Upside.
Could this change? Of Course. Remember anything can happen in a volatile market.
Commentary
The markets this past week has been making dramatic moves either Up or Down. This shows a market that lacks stability and is inclined to move in either direction (up or down) based upon the slightest whim in the financial markets. Today we have Retail Sales which is always a major market mover and certainly something the Federal Reserve will review when it comes down to rate decisions. And let's not forget, today is Tax Day. Over the weekend Iran attacked Israel with hundreds of drone missiles which didn't do much damage as most were intercepted in the air. Surprisingly enough crude oil has remained stable as Israel has not counter attacked as of yet. Time will tell how this all plays out.
Author

Nick Mastrandrea
Market Tea Leaves


