The SP500 Volume Pattern Suggests Distribution Over 2019

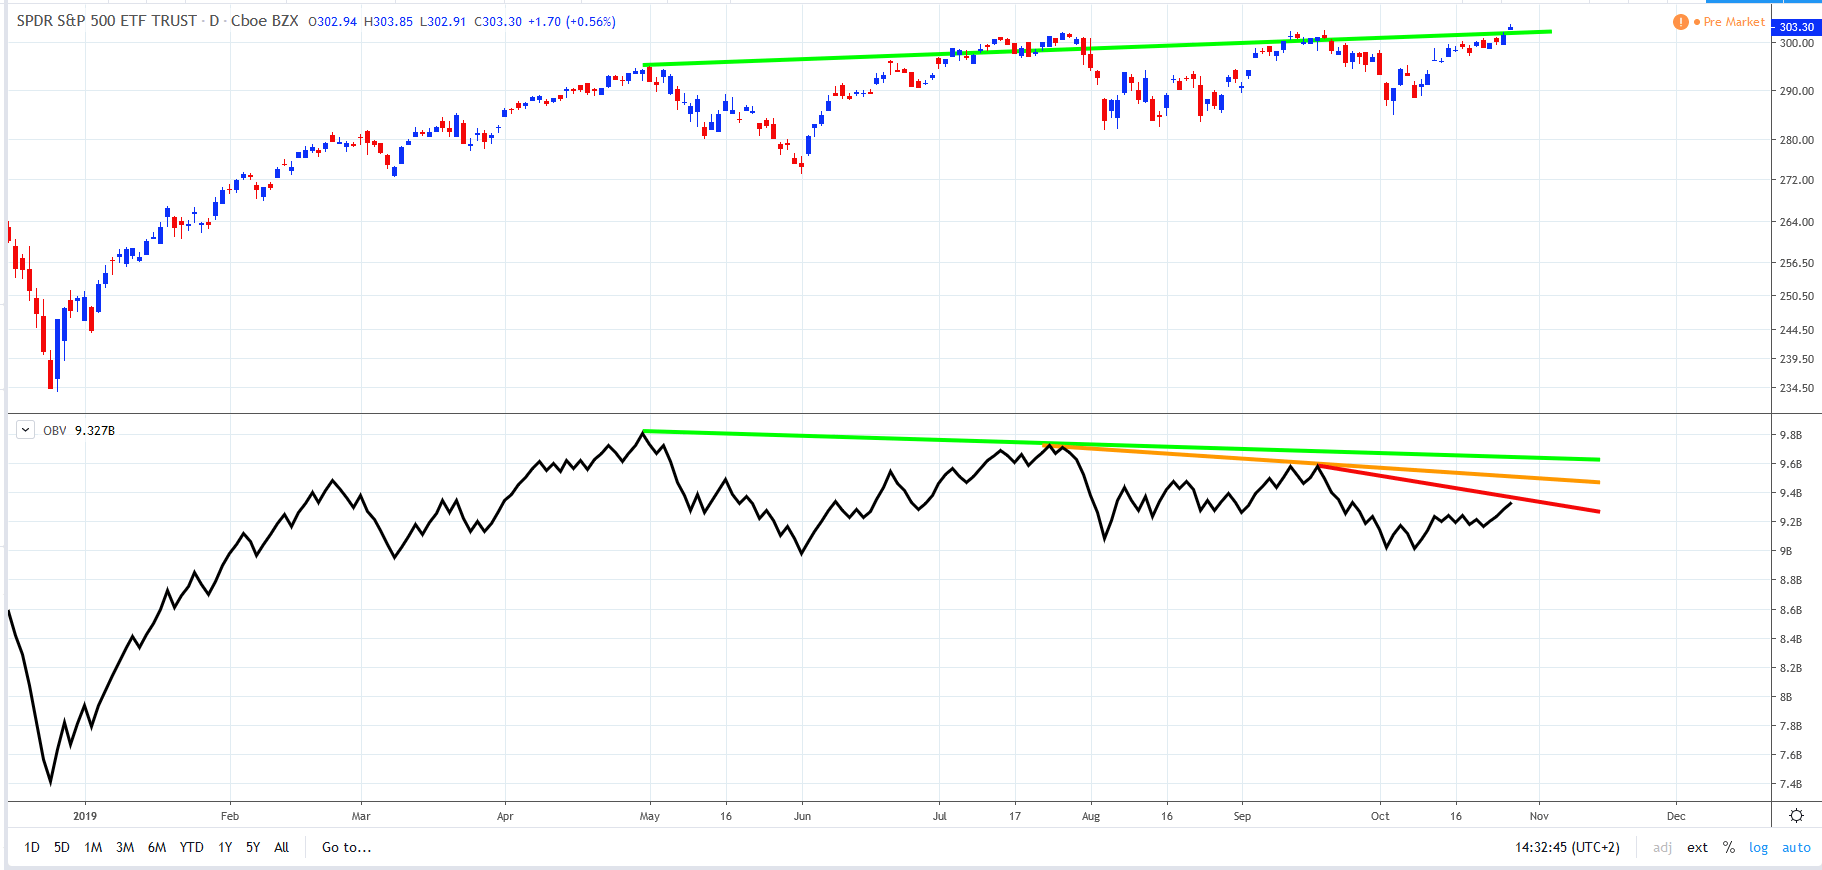
The below is the daily chart of the SPDR S&P 500 ETF. The ETF has made higher peaks over the course of 2019 (positive sloping green trendline). However, volume hasn’t mirrored that. The OBV indicator has diverged and has consistently made lower peaks over the same period. We note that the down sloping trendlines have shifted to steeper gradients as the year has progressed (green to orange to red). This disconnect may be signalling that a distribution of the S&P 500 is in progress. We continue to monitor.
Past performance is not an indicator of future results.
CHART SOURCE: WWW.TRADINGVIEW.COM
Author

Russell Shor (MSTA, CFTe, MFTA) has an Honours Degree in Economics from the University of South Africa and holds the coveted Certified Financial Technician and Master of Financial Technical Analysis qualifications from the Interna


