![]() Carley Garner
Carley Garner
DeCarley Trading
We monitor commodity market positioning and sentiment almost as much as we chart prices. We’ve witnessed an unusual conundrum; the spread between the market sentiment of industry insiders and the net long futures market position held in crude oil is unsustainably wide. Specifically, according to the Bullish Consensus Sentiment Index, about 70% of those polled are bullish crude oil. Nonetheless, the COT (Commitments of Traders) Report issued by the CFTC (Commodity Futures Trading Commission) suggests that a mere 250,000 net long contracts are currently being held. This is substantially below the half-a-million contracts held last year and, even more so, below the 750,000 all-time high net long position. If the so-called “smart money” decided to put their money where their mouths are, oil could see $92.00 per barrel, at minimum, and possibly even reach the low triple digits!
Seasonally, the oil market has a tendency to peak in mid-to-late October, so that leaves multiple weeks of seasonal support. Further, we are still burning off the fumes of the 2020 COVID stimulus and liquidity injection campaigns; higher fuel prices haven’t hurt the travel industry. I’ve been traveling for work and pleasure; I can attest flying in 2023 is not the same as in 2019. Lost luggage, delayed flights, canceled flights, and other inconveniences are expected obstacles, not outliers, yet there are butts in seats. In fact, TSA data reports record traffic!
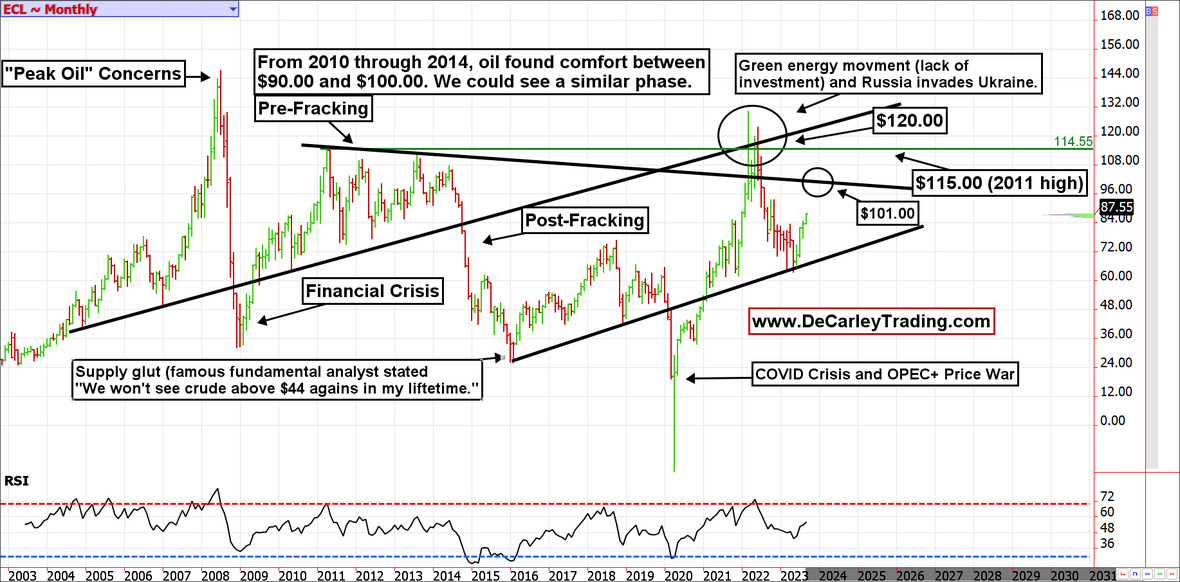
Monthly Crude Oil Futures
Revisiting the monthly oil chart, it is clear that prices held an uptrend line that dates back to the 2016 low (COVID shutdowns and an OPEC+ price war temporarily and violently breached this trendline). We see a similar downtrend line that dates back to 2010 (the Russian invasion of Ukraine temporarily and violently breached this trendline); this line comes in near $101.00 and will likely act as a price magnet. Confirming this idea is an RSI (Relative Strength Index) oscillator pointing higher with plenty of room to run before the market could be considered overbought.
Weekly Crude Oil Futures
Like the monthly chart, the weekly chart of oil futures suggests a move to $101.00 is in play. Weakness earlier this year found support near the 200-day moving average and pushed prices into what we believe is an equilibrium range between $75.00 and $101.00. According to our charts, this is the natural price range that likely would have existed if the black swan events from 2020 through 2022 were removed.
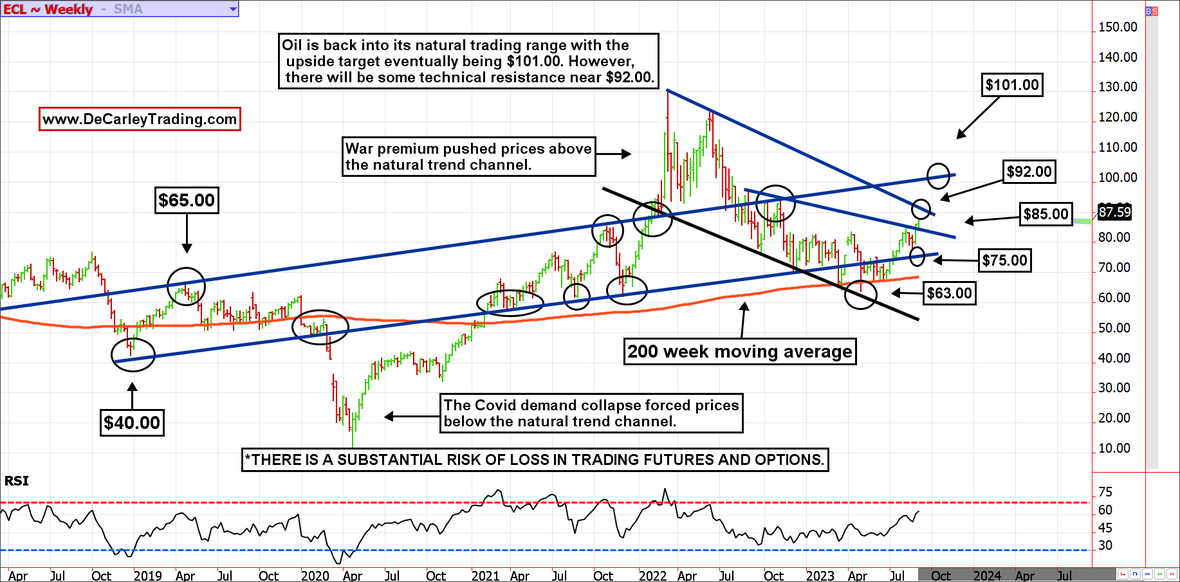
We suspect some rough waters near $92.00 based on a sharp downtrend line stemming from the 2022 top. Still, if the pessimism over China’s economic data dissipates and interest rates stabilize, triple-digit crude oil is likely (in our humble opinion).
Due to the volatile nature of the futures markets some information and charts in this report may not be timely. There is substantial risk of loss in trading futures and options. Past performance is not indicative of future results. The information and data in this report were obtained from sources considered reliable. Their accuracy or completeness is not guaranteed and the giving of the same is not to be deemed as an offer or solicitation on our part with respect to the sale or purchase of any securities or commodities. Any decision to purchase or sell as a result of the opinions expressed in this report will be the full responsibility of the person authorizing such transaction.
Recommended Content
Editors’ Picks

EUR/USD bounces off 1.1300, Dollar turns red
After bottoming out near the 1.1300 region, EUR/USD now regains upside traction and advances to the 1.1370 area on the back of the ongoing knee-jerk in the US Dollar. Meanwhile, market participants continue to closely follow news surrounding the US-China trade war.

GBP/USD regains pace, retargets 1.3200
The now offered stance in the Greenback lends extra support to GBP/USD and sends the pair back to the vicinity of the 1.3200 hurdle, or multi-day highs, amid a generalised better tone in the risk-linked universe on Monday.

Gold trades with marked losses near $2,200
Gold seems to have met some daily contention around the $3,200 zone on Monday, coming under renewed downside pressure after hitting record highs near $3,250 earlier in the day, always amid alleviated trade concerns. Declining US yields, in the meantime, should keep the downside contained somehow.

Six Fundamentals for the Week: Tariffs, US Retail Sales and ECB stand out Premium
"Nobody is off the hook" – these words by US President Donald Trump keep markets focused on tariff policy. However, some hard data and the European Central Bank (ECB) decision will also keep things busy ahead of Good Friday.

Is a recession looming?
Wall Street skyrockets after Trump announces tariff delay. But gains remain limited as Trade War with China continues. Recession odds have eased, but investors remain fearful. The worst may not be over, deeper market wounds still possible.

The Best brokers to trade EUR/USD
SPONSORED Discover the top brokers for trading EUR/USD in 2025. Our list features brokers with competitive spreads, fast execution, and powerful platforms. Whether you're a beginner or an expert, find the right partner to navigate the dynamic Forex market.