The ‘real’ dynamics of core inflation in the eurozone
As the European Central Bank has been putting increasing emphasis on the recent readings of underlying inflation, it is more important to look at the short-term dynamics than at the year-on-year figures. While some easing of inflationary tensions is indeed observable, it would be premature to exclude another rate hike.
Why core inflation matters for the ECB
The flash estimates showed that eurozone headline inflation fell to 5.3% in July, while core inflation stabilised at 5.5%. At the next monetary meeting of the ECB’s Governing Council, the bank will have only one additional inflation figure at its disposal to decide whether it will hike rates again or pause its tightening cycle. Christine Lagarde stressed several times during the July press conference that the ECB is determined to break the back of inflation and to take inflation back to 2% in the medium term on a sustainable basis. We also know that the “dynamics of underlying inflation” play an important role, as this was singled out as one of three criteria on which policy decisions would be based (the other two being the assessment of the inflation outlook and the strength of monetary transmission). And it’s probably even the most important criterion, as the ECB has started to have serious doubts about the forecasting ability of its models.
But how these dynamics are actually studied is an open question. In the German press, a comment made by an unnamed official source in Sintra was interpreted as if the ECB would stop its tightening cycle after three consecutive falls in core inflation. Since core inflation has not even started to fall, the end of interest rate hikes doesn’t seem to be near following that reasoning. However, not too much emphasis should be put on comments from anonymous sources. And while we surely believe that a decline in core inflation could be a trigger for the ECB to change gear, we doubt that monetary policy would be based on a mechanical rule.
Changing inflation dynamics
Three-month on three-month annualised change in prices (in %).
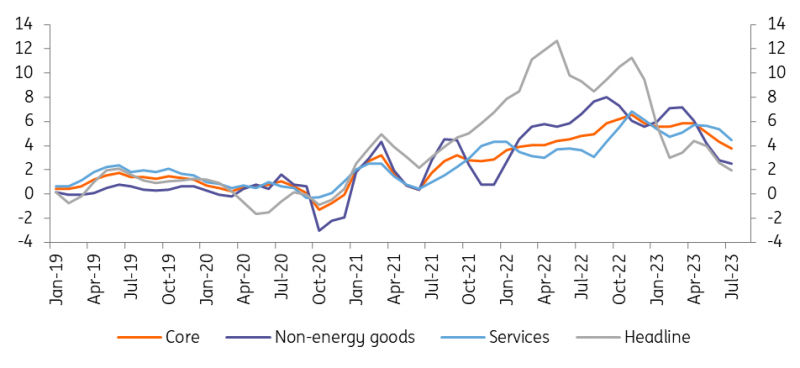
Source: Refinitiv Datastream
Don’t be fooled by year-on-year inflation figures
Another issue is how to measure the “dynamics of underlying inflation”. Looking at the year-on-year core inflation figures says as much about last year’s price level as today’s. Base effects can indeed have a very strong impact. As such, the current year-on-year core inflation figures in the eurozone have been affected by the temporary introduction of a cheap train ticket in Germany last year. Therefore, it is much more interesting to look just at the evolution of prices in recent months, using data with seasonal adjustments published by the ECB. Since month-on-month changes are a bit more volatile, we take the three-month on three-month annualised change in seasonally adjusted prices.
The good news is that if you look at headline inflation, this measure stands at 2%, though this figure is of course heavily influenced by energy prices. Inflation without food and energy, which stood at 5.8% in April, came in at 3.8% in July. That’s already a nice decline, but still clearly above the 2% target. More in detail, the rapid fall of non-energy industrial goods price inflation is striking, a consequence of the ongoing inventory correction and the fall in input prices. However, services price inflation, while also declining, still stands at 4.5%. Survey data suggests that the slow downward trend will continue, but if the ECB’s criterion is the current “dynamics of underlying inflation”, then it would certainly be premature to exclude a 4% deposit rate.
Read the original analysis: The ‘real’ dynamics of core inflation in the eurozone
Author

Peter Vanden Houte
ING Economic and Financial Analysis
Peter Vanden Houte is Chief Economist Belgium, Eurozone and has been working with ING in various research functions for the last 20 years. He is also chairman of the “economic commission” at the Belgian Employers Federation.


