The not so Magnificent Seven
S2N spotlight
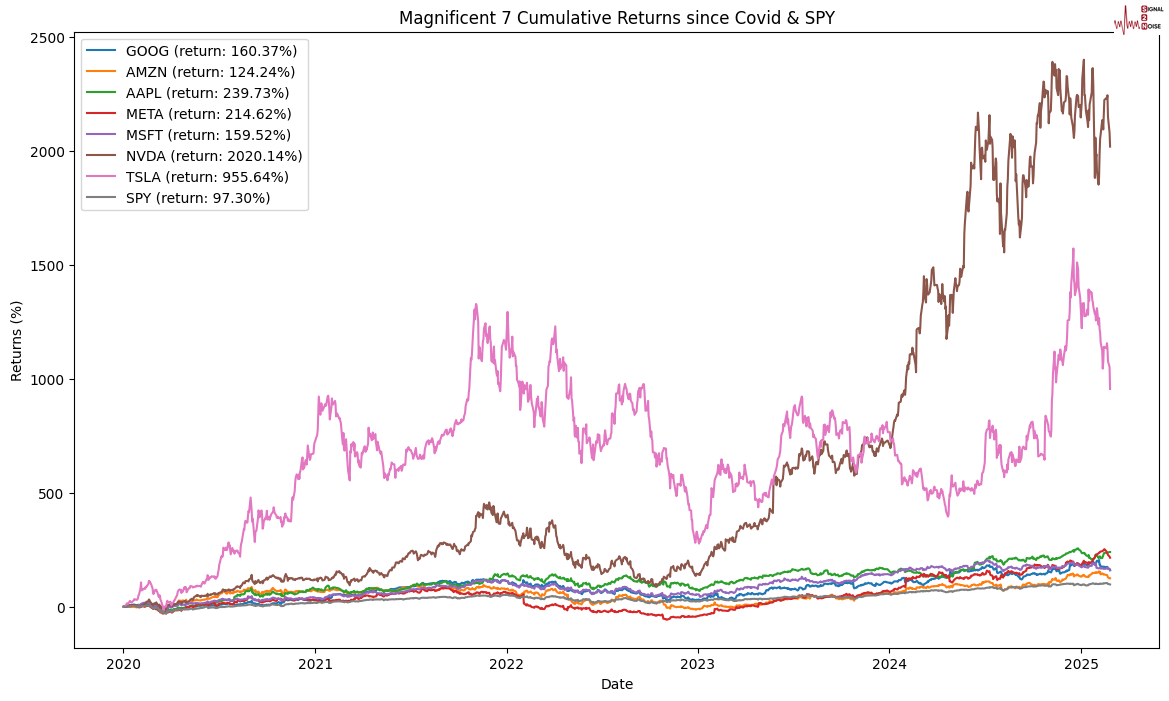
Would you believe there is an ETF called MAGS with over $1 billion of assets under management, providing an easy way for investors to buy their favourite names. It really has been the Nvidia and Tesla show, but all shows come to an end; not all have Hollywood endings.
Some historic facts.
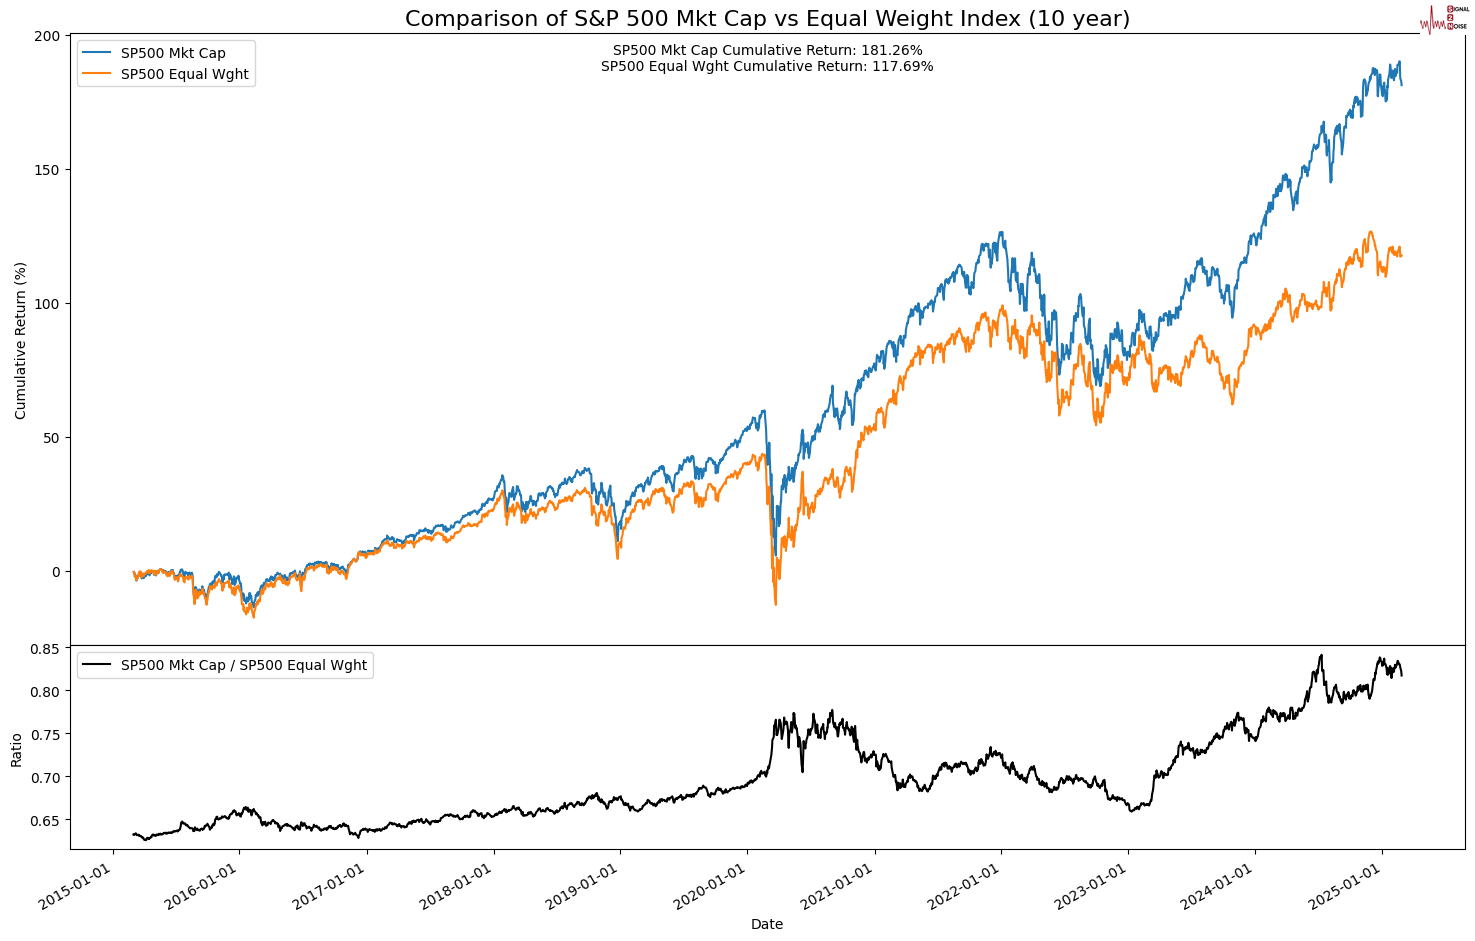
Zero of the top 10 companies in the S&P 500 30 years ago are still in the top 10. Two companies that were in the top 10 20 years ago are still in the top 10. With that introduction, let us look at the relative performance of the S&P 500 Market Cap weighted index, the one we all know and see quoted, and the S&P 500 Equal weighted index that most don’t spew (that is the symbol ticker) over.
As you can see, the longer the time frame, the more likely that the equal weighted index will outperform.
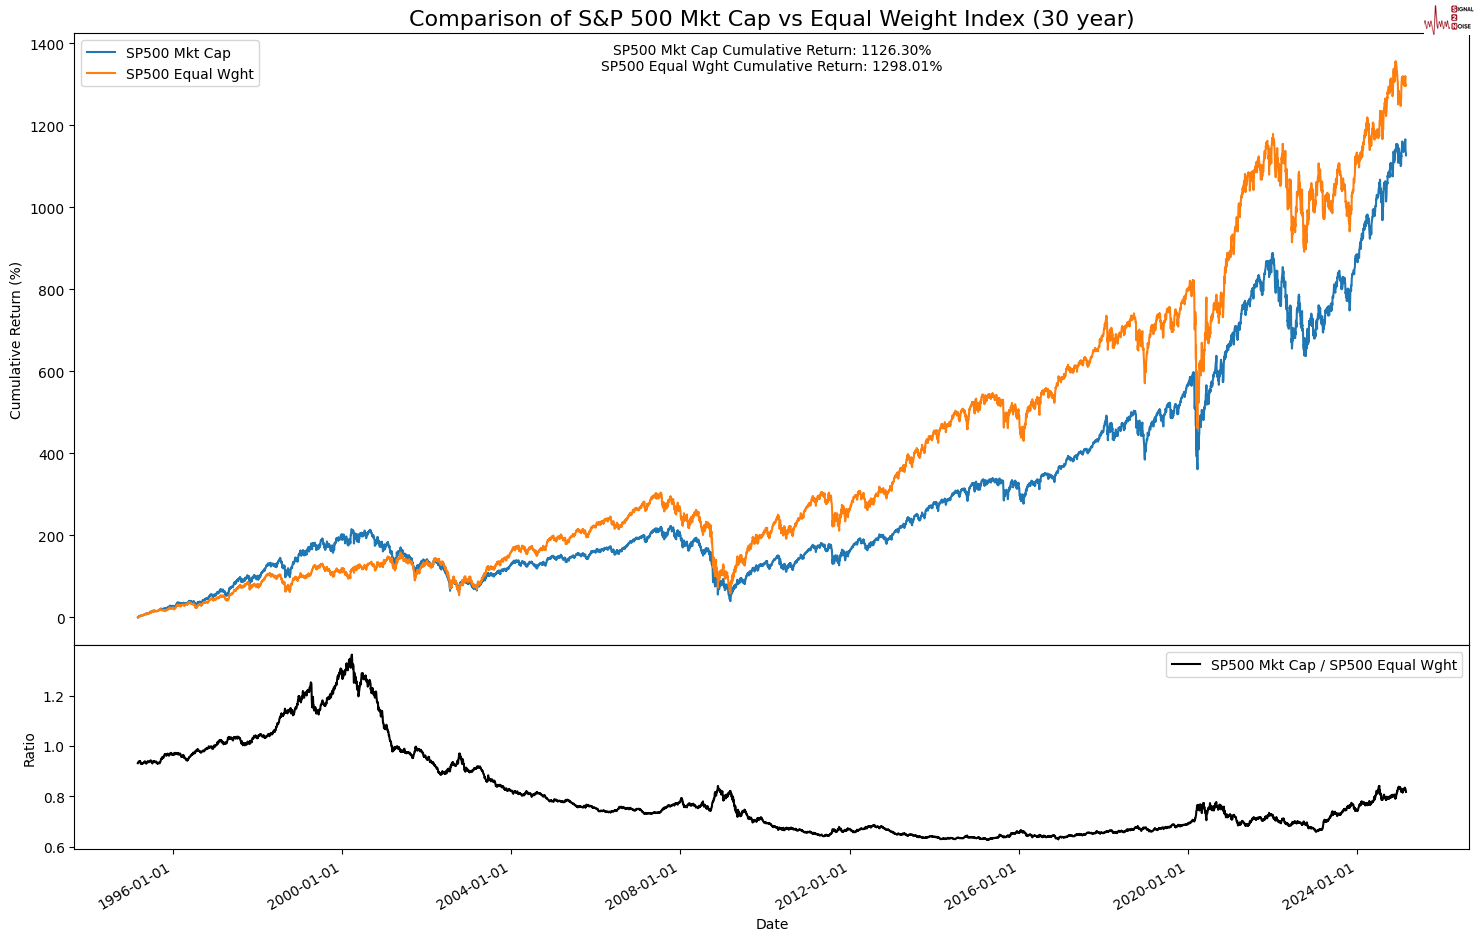
Over the last 20 years, it has been relatively equal, with some interesting divergences over the period one could have played the relative trade game.
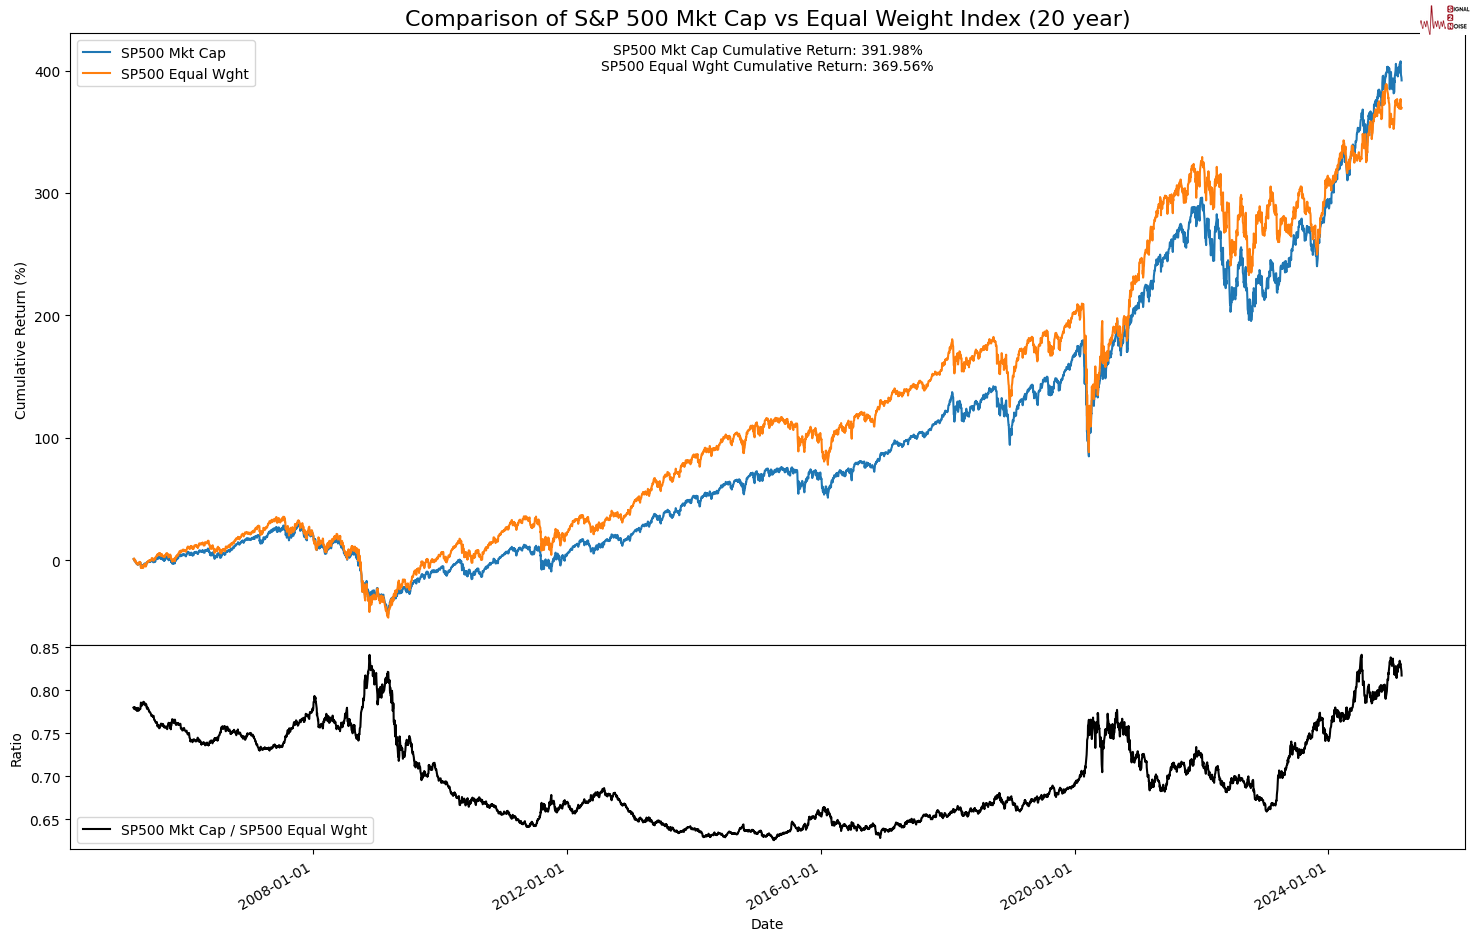
The next 2 charts over 10 and 2 years present the trading opportunity I see. This looks very similar to my trade setup with long China short US. Last year, when the ratio got to its most extreme point, I called for a short of SPX and long SPEW to capture a return to less extremes that gave birth to the Magnificent 7 and the FANGS and other acronyms.
S2N observations
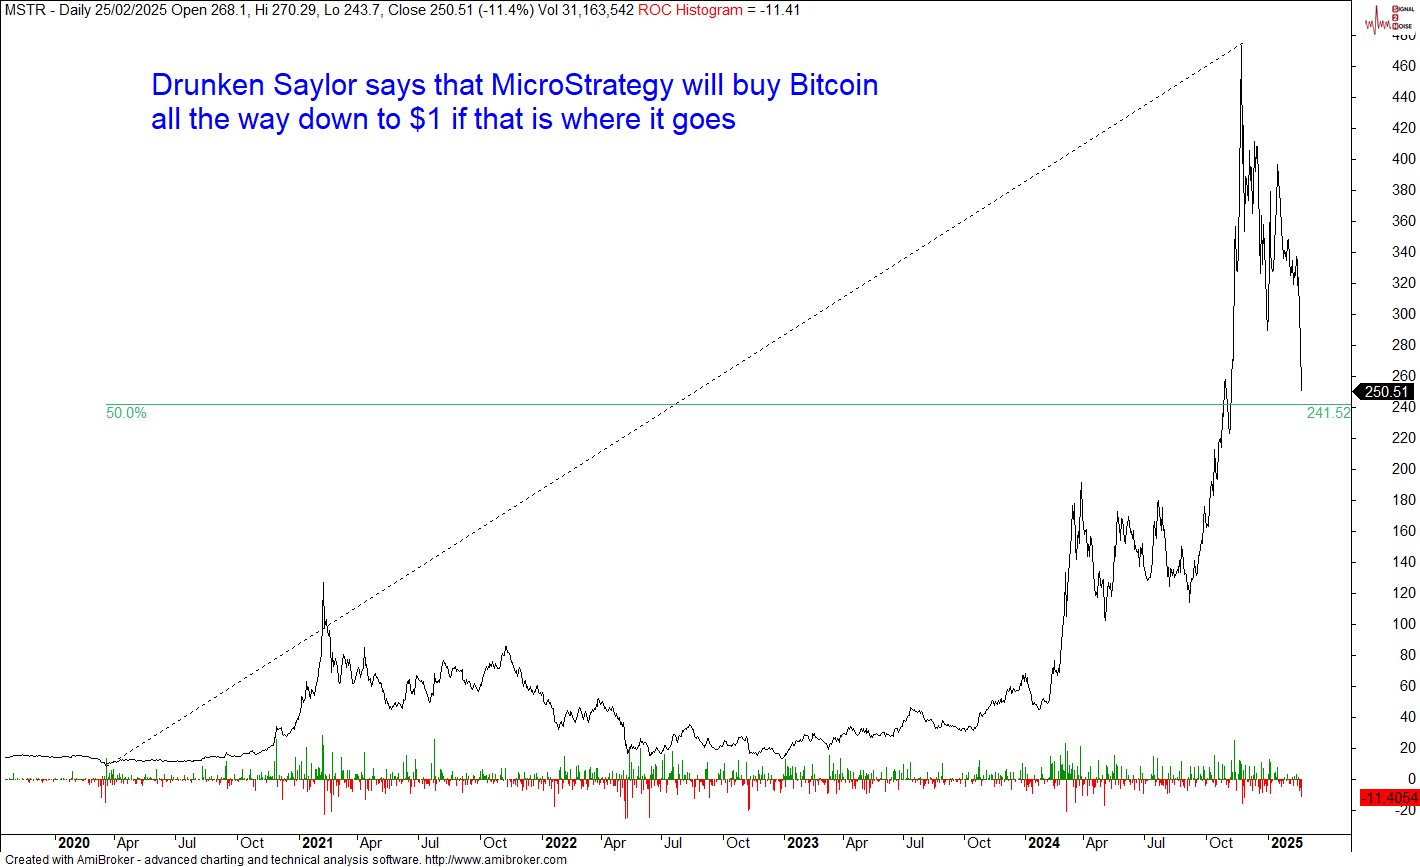
I mentioned yesterday that the average cost for MicroStrategy is $67,000 a bitcoin. The question a lot of people ask is, What the liquidation point is? There is roughly $8 billion of convertible debt on the balance sheet, but this is not an issue to force a liquidation. The truth is the course has been set by Drunken Saylor, and he has the votes. This ship either sails to a new wonderland or it crashes on the rocks.
The biggest challenge the Saylor model has is raising capital. The business is built around issuing shares at a premium to buy Bitcoin, expressing the premium gap as “yield”.
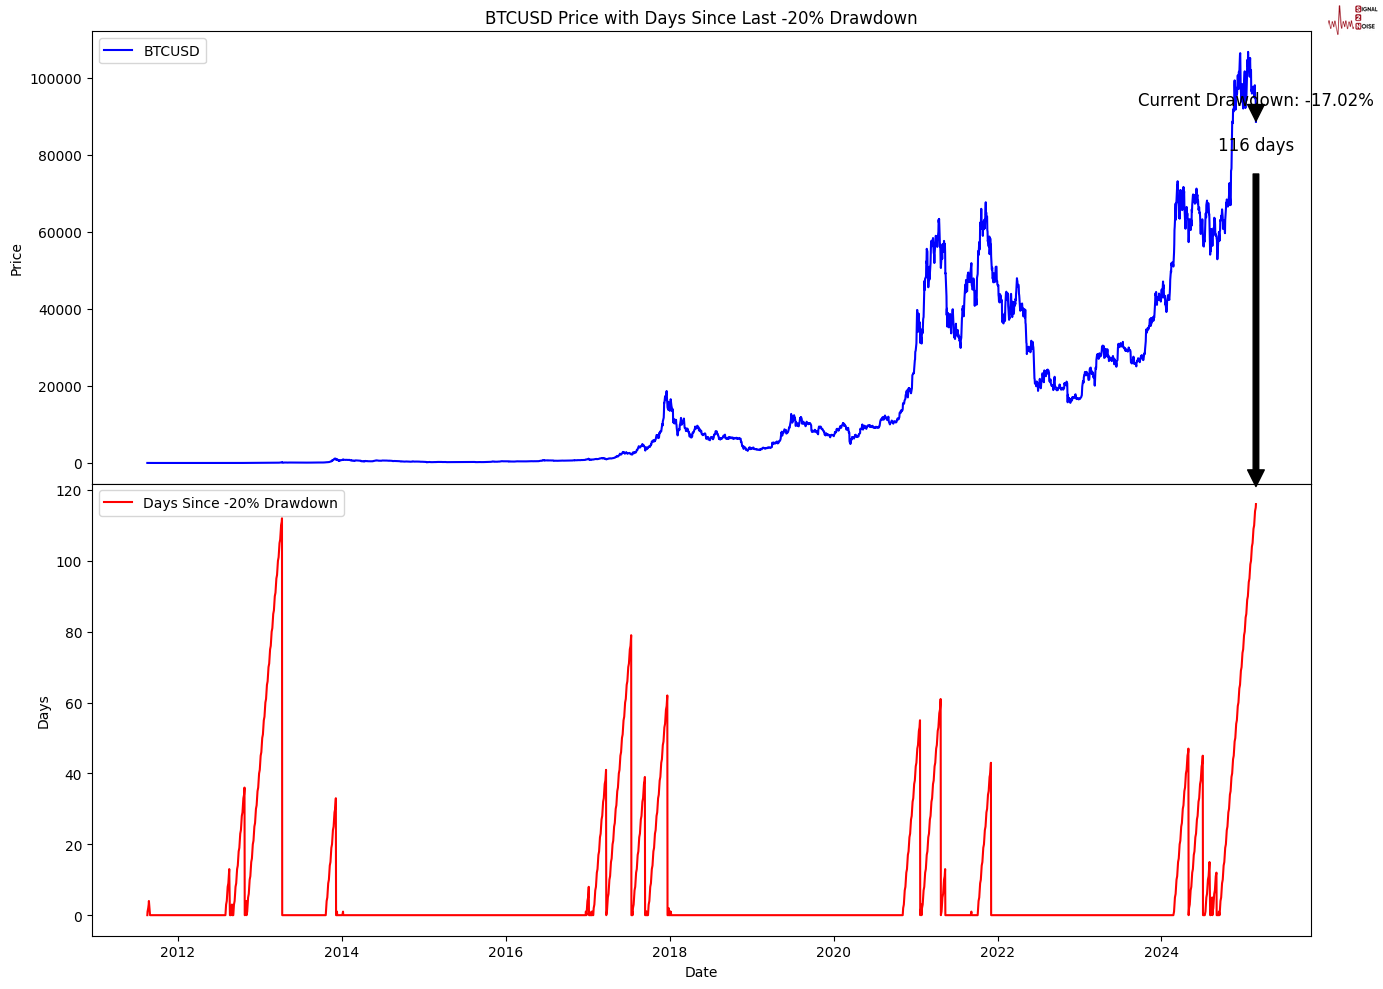
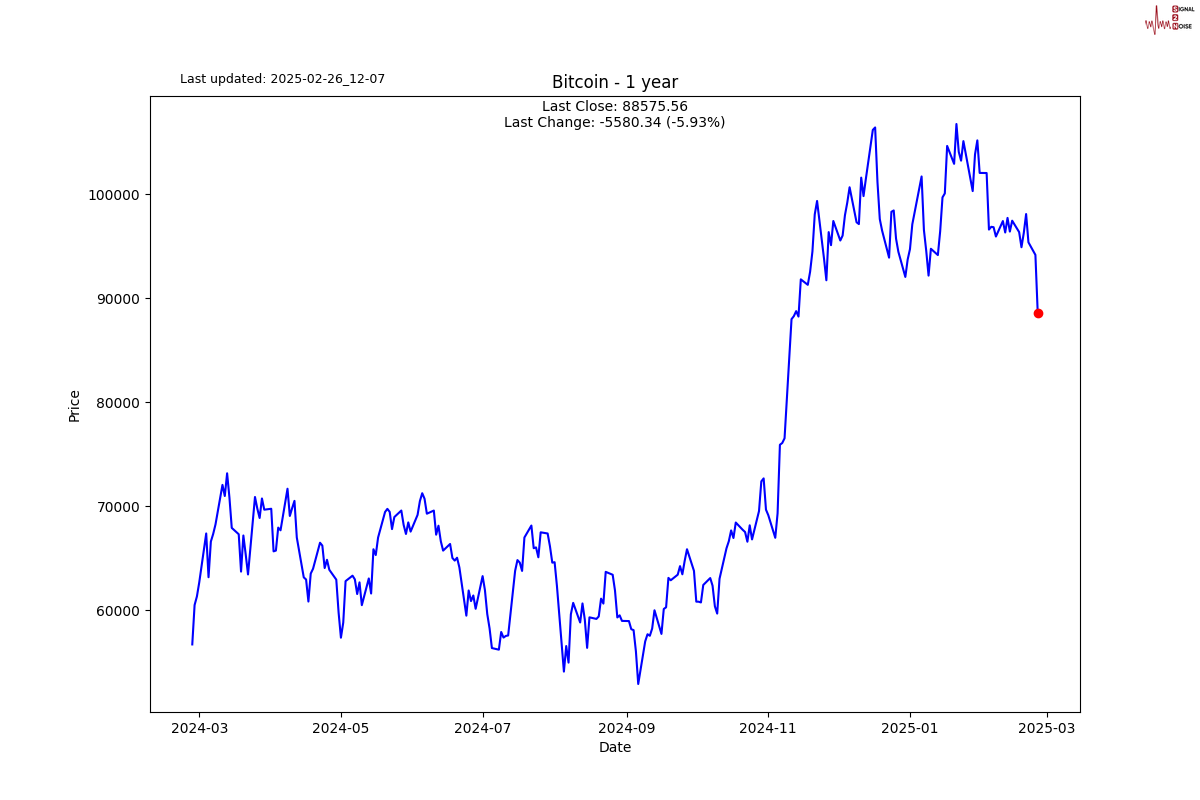
I am using Bitcoin CME futures data in this series, so it might be a bit delayed as some people on X are saying Bitcoin is in bear market territory. I assume that means we are in a 20% drawdown. The chart below showed a -17%, but I wanted to highlight that it has been 120 days since a -20% DD. This would suggest we are due a bear market contraction, which we might have already entered.
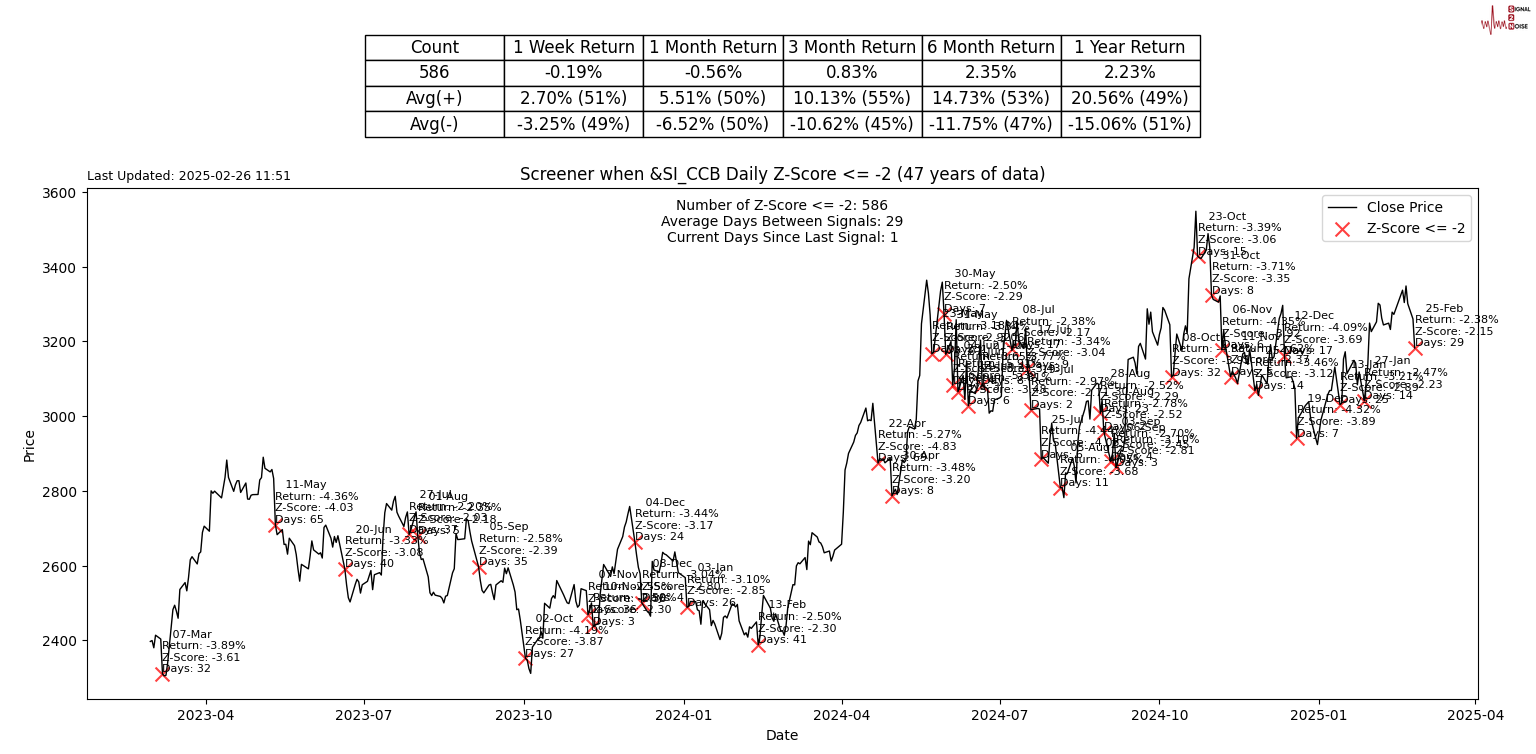
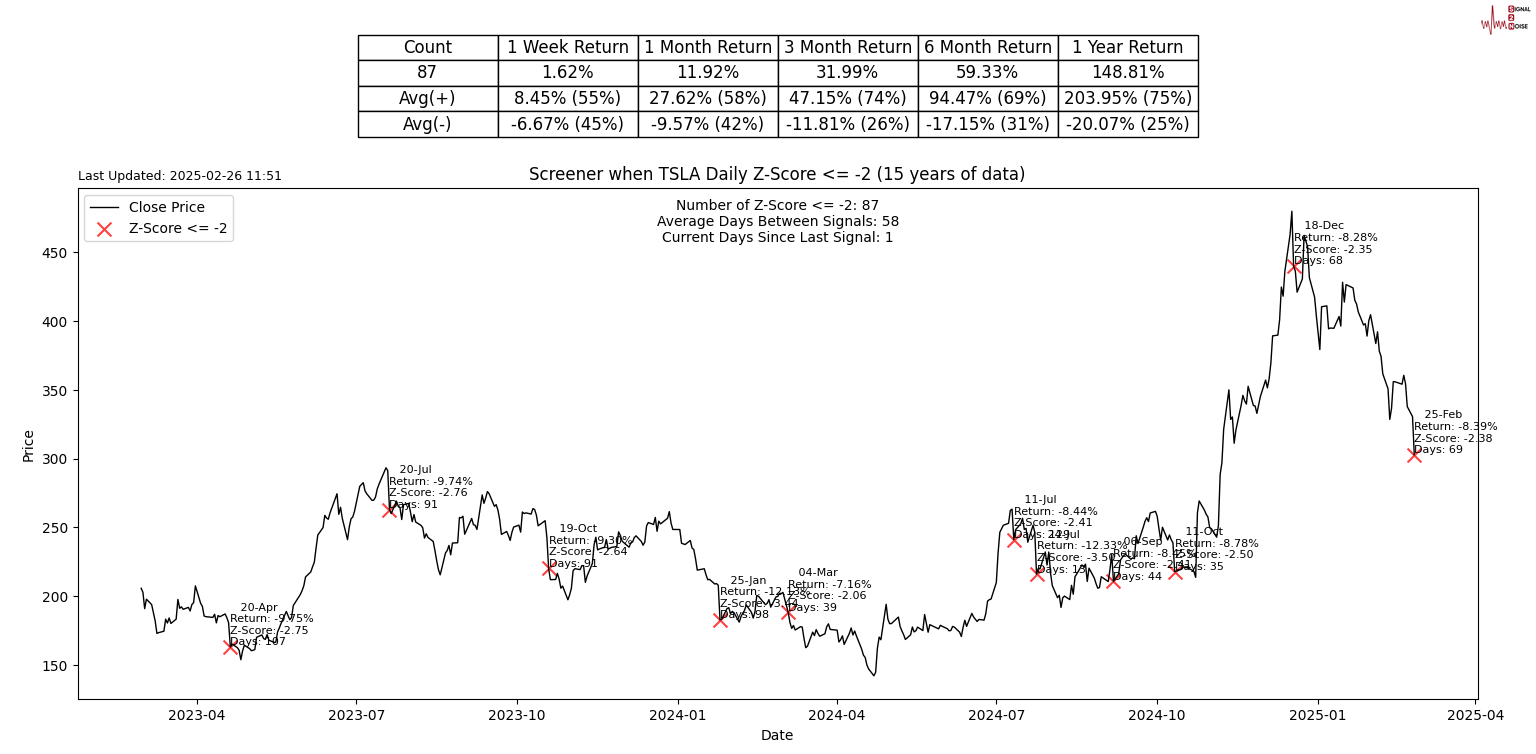
S2N screener alerts
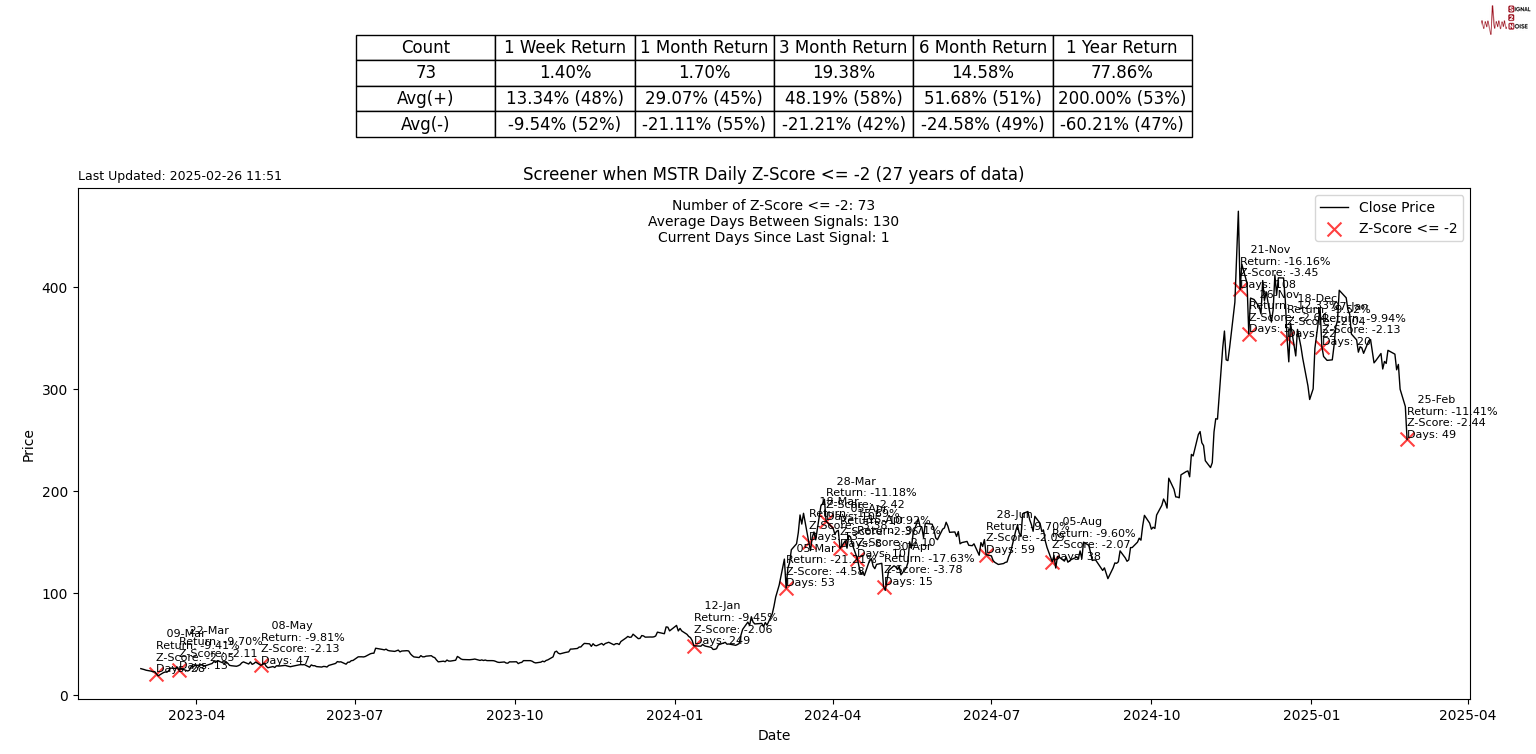
Here are 3 assets that dropped more than 2 standard deviations on the day. MicroStrategy, Silver Futures, & Tesla. All 3 have positive expectancy beyond a 1-month hold. Who is buying?
Performance review
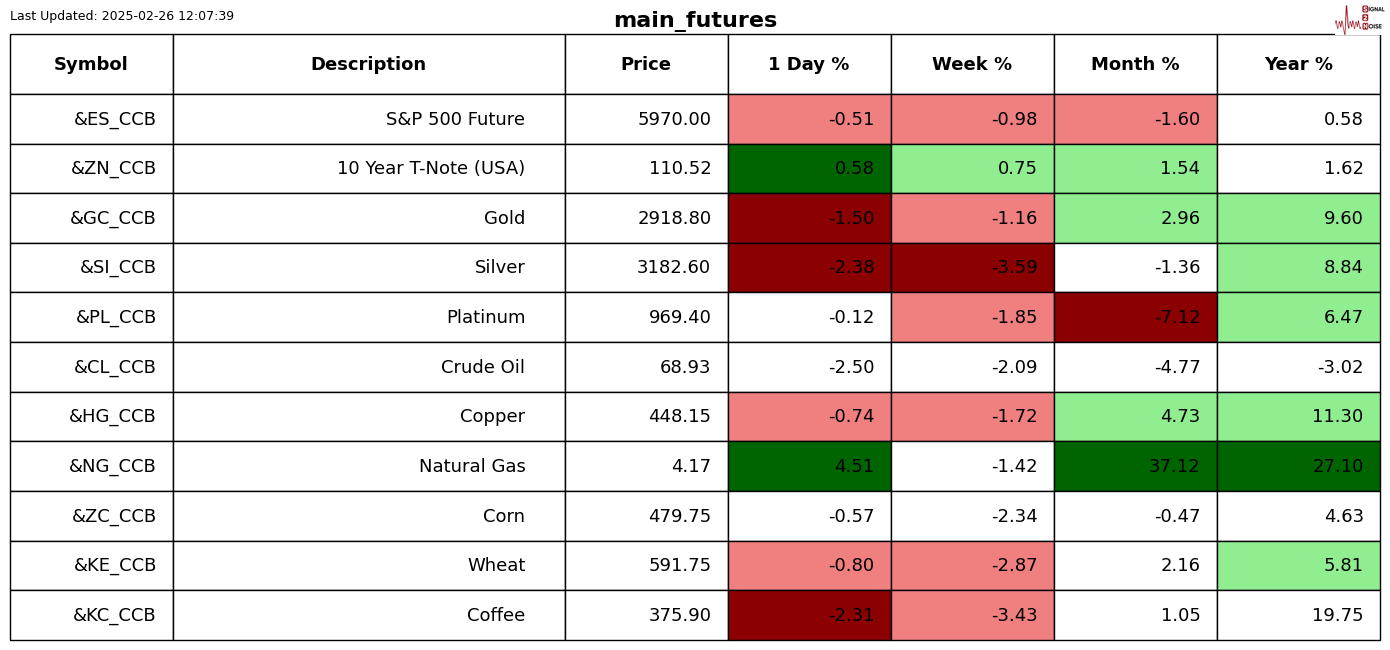
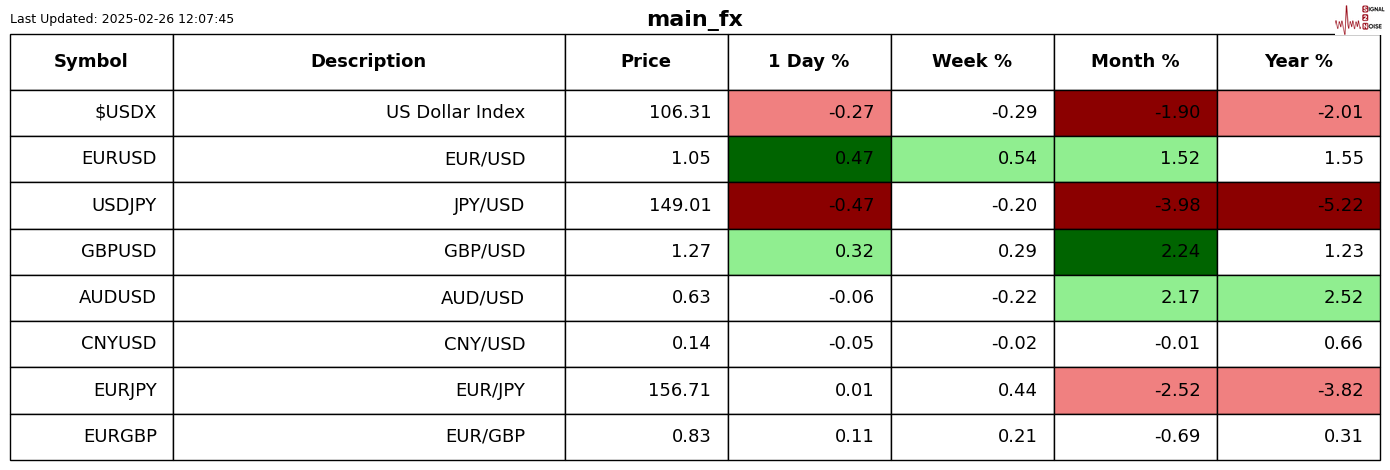
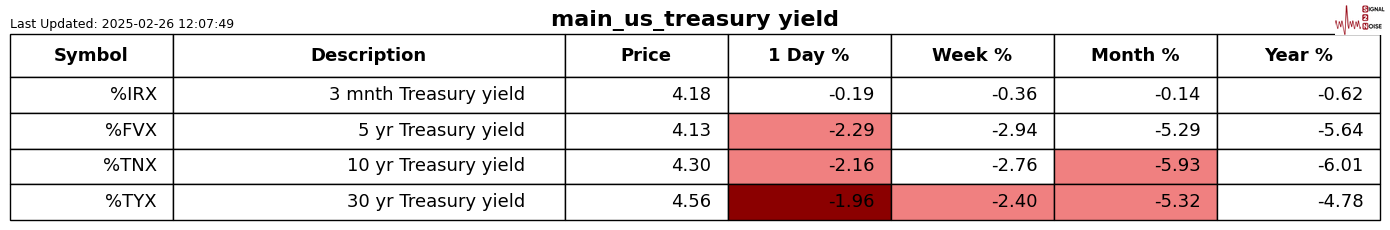
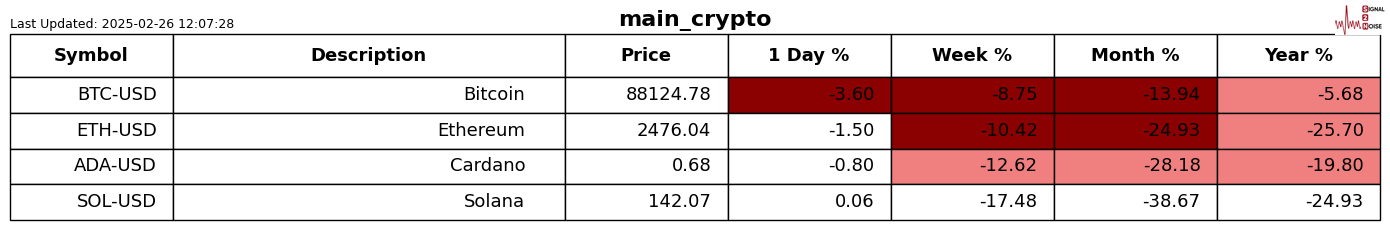
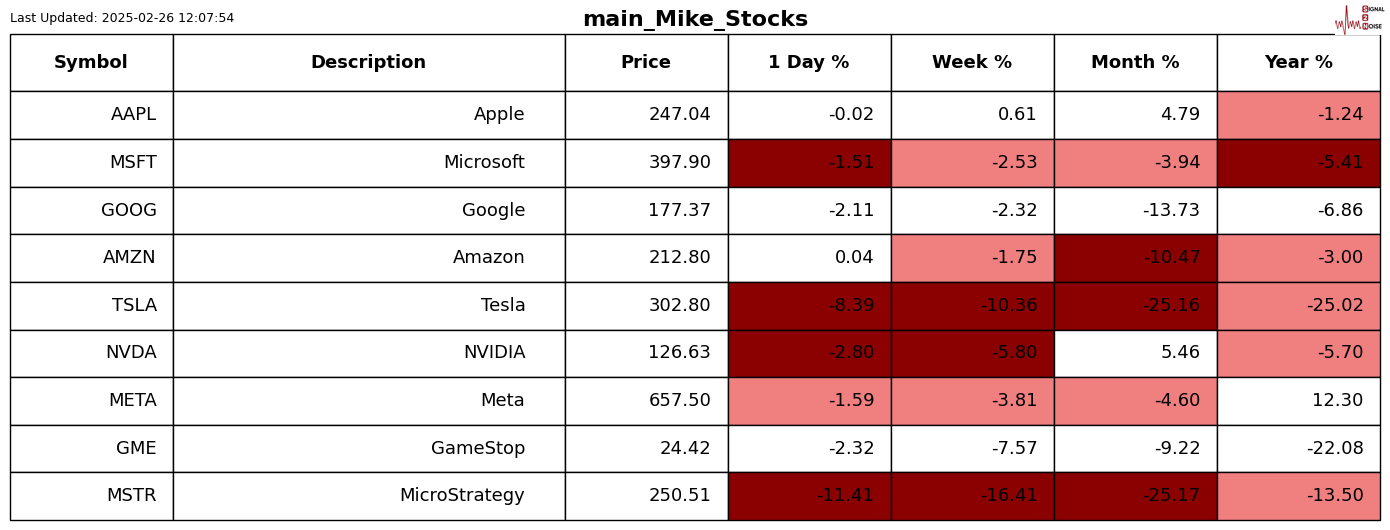
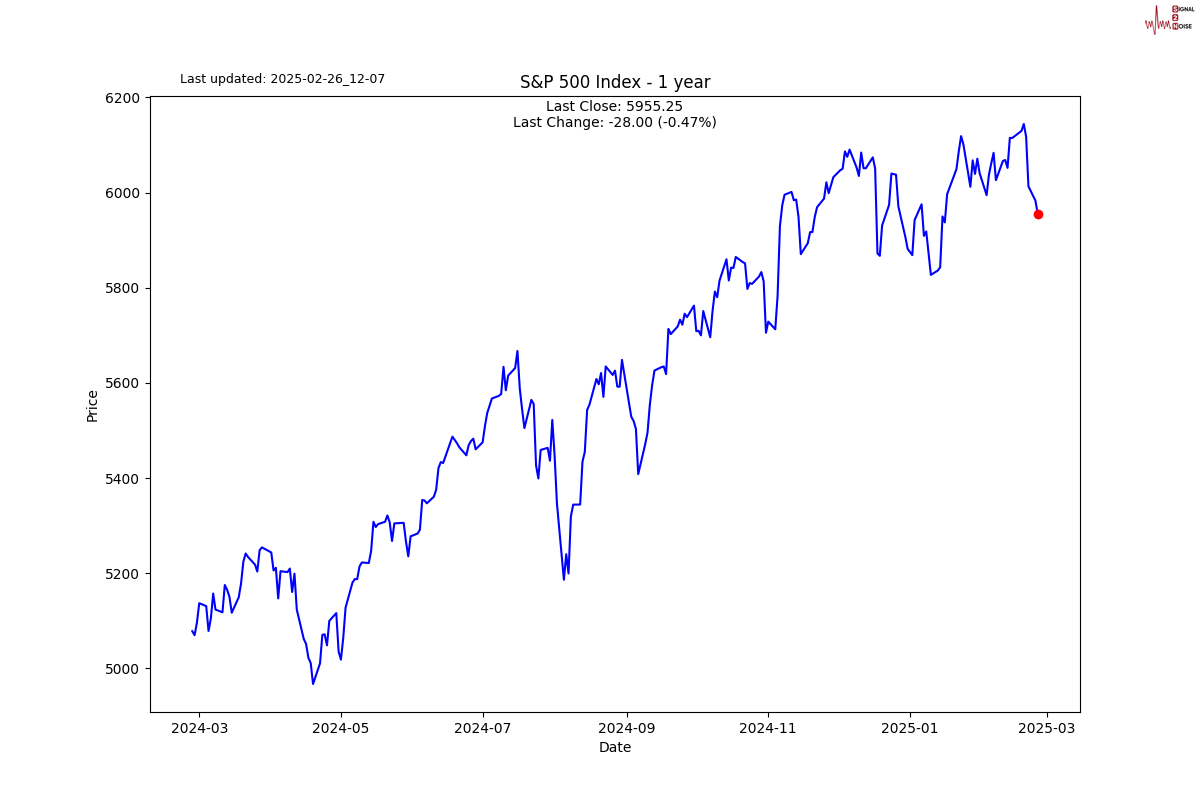
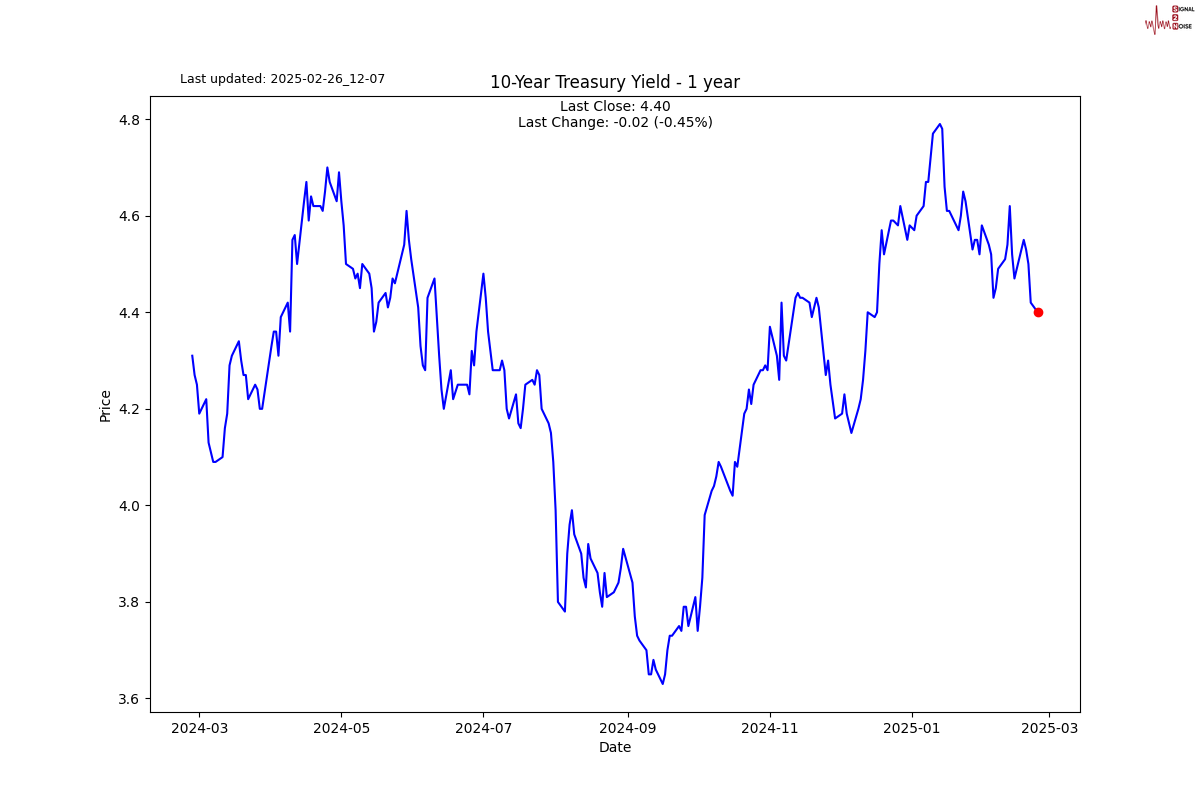
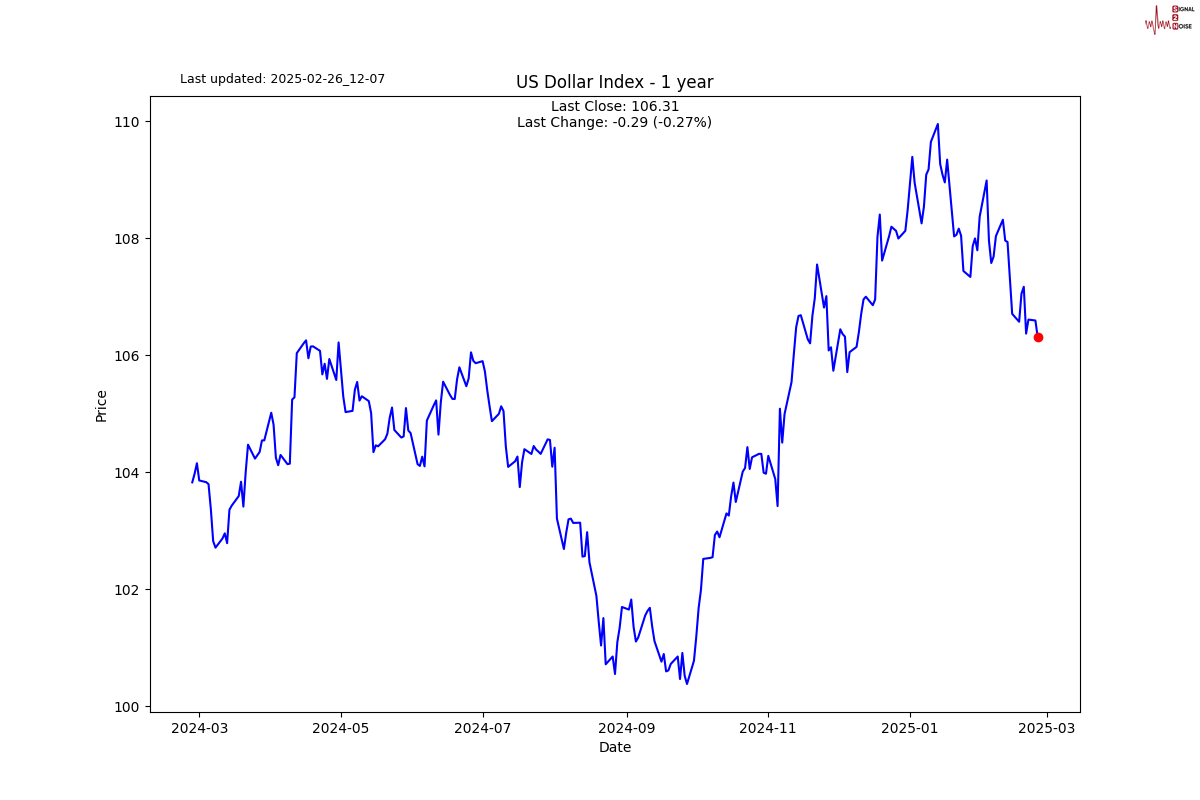
Chart gallery
News today
Author

Michael Berman, PhD
Signal2Noise (S2N) News
Michael has decades of experience as a professional trader, hedge fund manager and incubator of emerging traders.


