The Nasdaq price pressure is undeniable

S&P 500 went almost perfectly sideways, and then upwards aftermarket in a mixed reaction to earnings, where SNAP disappointed – and that has consequences for today‘s internet space incl. weaker semiconductor stocks. The Nasdaq price pressure is undeniable, yet for rotations into the rest except defensives, is saving the day – all of these have the backdrop of still strong consumer, with PMIs improving, and I‘m looking at manufacturing that I have been in latest weeks covering in a bullish manner (it‘s turning up, and that leaves little room for significant pressure on stock prices).
There are though pockets of weakness too, chiefly sectors and subsectors that have had to adjust to really no rate cut Mar (21% odds now only) – it must be getting bad when Yellen‘s attention is turning to regional banks and commercial real estate too.
When have you heard me talking Russell 2000 bullishly last? In a proper manner, before the end of the year, and then when it comes to prognostications for more solid 2024 year end – too many zombie companies out there depending on cheap financing, and with BTFP leaving stage right soon…
This is the time of a selective S&P 500 market, with the frequently raised question of larger correction getting my answer of a sideways move a la second half of Nov 2023 being more probable.
Let‘s move right into the charts – today‘s full scale article contains 3 of them, featuring S&P 500, precious metals and oil.
Tired of seeing those red boxes instead of way more valuable information? Try the premium services based on what and how you trade.
S&P 500 and Nasdaq
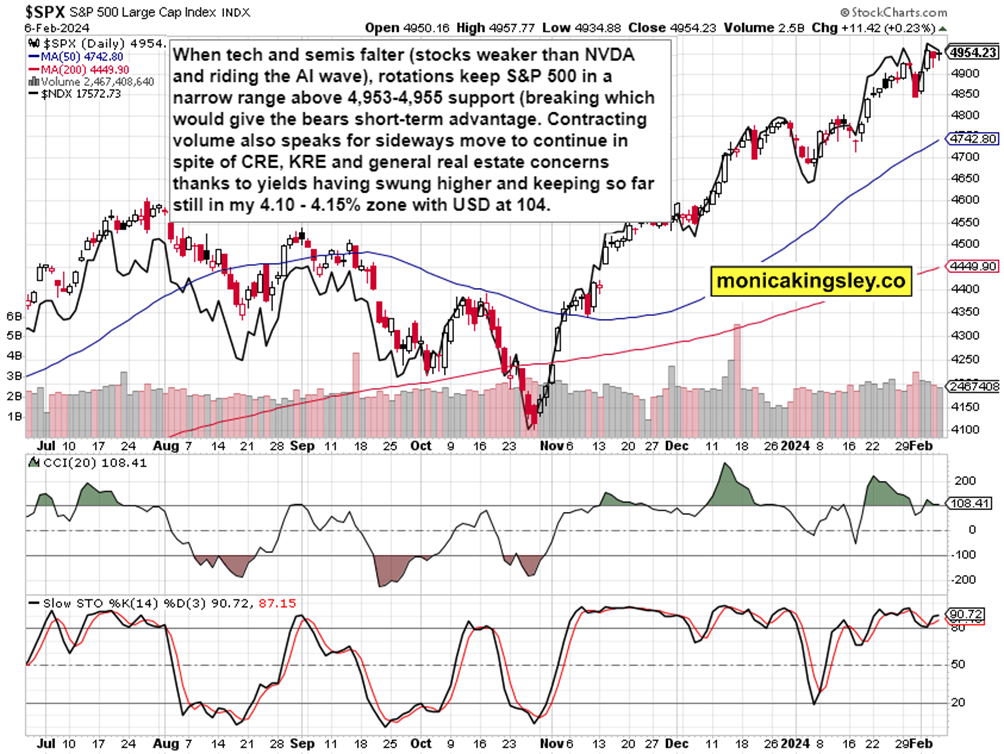
If the volume was higher, odds of a correction worth more than two dozen points, would rise significantly. For now, it‘s just not there, no hint of that appearing – the sellers fumbled yersterday, and not even China stocks price path or Evergrande is having an effect – the focus is on China‘s stimulus and quite positive global liquidity still.
Crude Oil

Crude oil is a very cautious hold rather than buy, yet must be exited fast if it goes quickly on rising volume for even merely $82.25, which is the level that would serve as a better entry area in case of a hesitant decline not attracting many sellers. Once the Mideast moves into the forefront again though...
Author

Monica Kingsley
Monicakingsley
Monica Kingsley is a trader and financial analyst serving countless investors and traders since Feb 2020.


