The most important analogy for the markets, including Gold

Some say that war never changes, and in some aspects, that’s true. But markets’ reactions to war are also remarkably similar.
Tracking war concerns
What I’m going to start today’s analysis with is not something you’ll read in many places. Usually, analysts are either following just the technicals or just the fundamental aspects of a given market. But the true edge comes from combining both worlds. From really understanding the basics and then applying them in ways that are not necessarily popular, but that work remarkably well, nonetheless.
So, the key rule behind the technical analysis is that the history rhymes. Similar situations price- and volume-wise trigger similar emotional responses, which in turn trigger similar reactions to news or events, regardless of what they are. As humans don’t become less emotional – in general – over time, technical analysis continues to work, and we can compare the same patterns across various times, even though the geopolitical situation in the world changes dynamically.
The next key thing that I want to emphasize is that markets react to expectations and concerns much more than they react to facts. In fact, sometimes markets can move in the opposite way to what a given news release “should” cause, just because the expectations were missed. Remember when stocks plunged in 2008 after Bernanke cut rates by 0.75%? Pointless? Maybe so, but the market expected an even bigger move.
This is exactly why fear or concern about a major military conflict is something that is much more likely to cause the markets to move than the conflict itself.
The below chart from Google Trends shows just how significantly the concern with “war” increased and then… It faded away, even though the wars themselves haven’t.
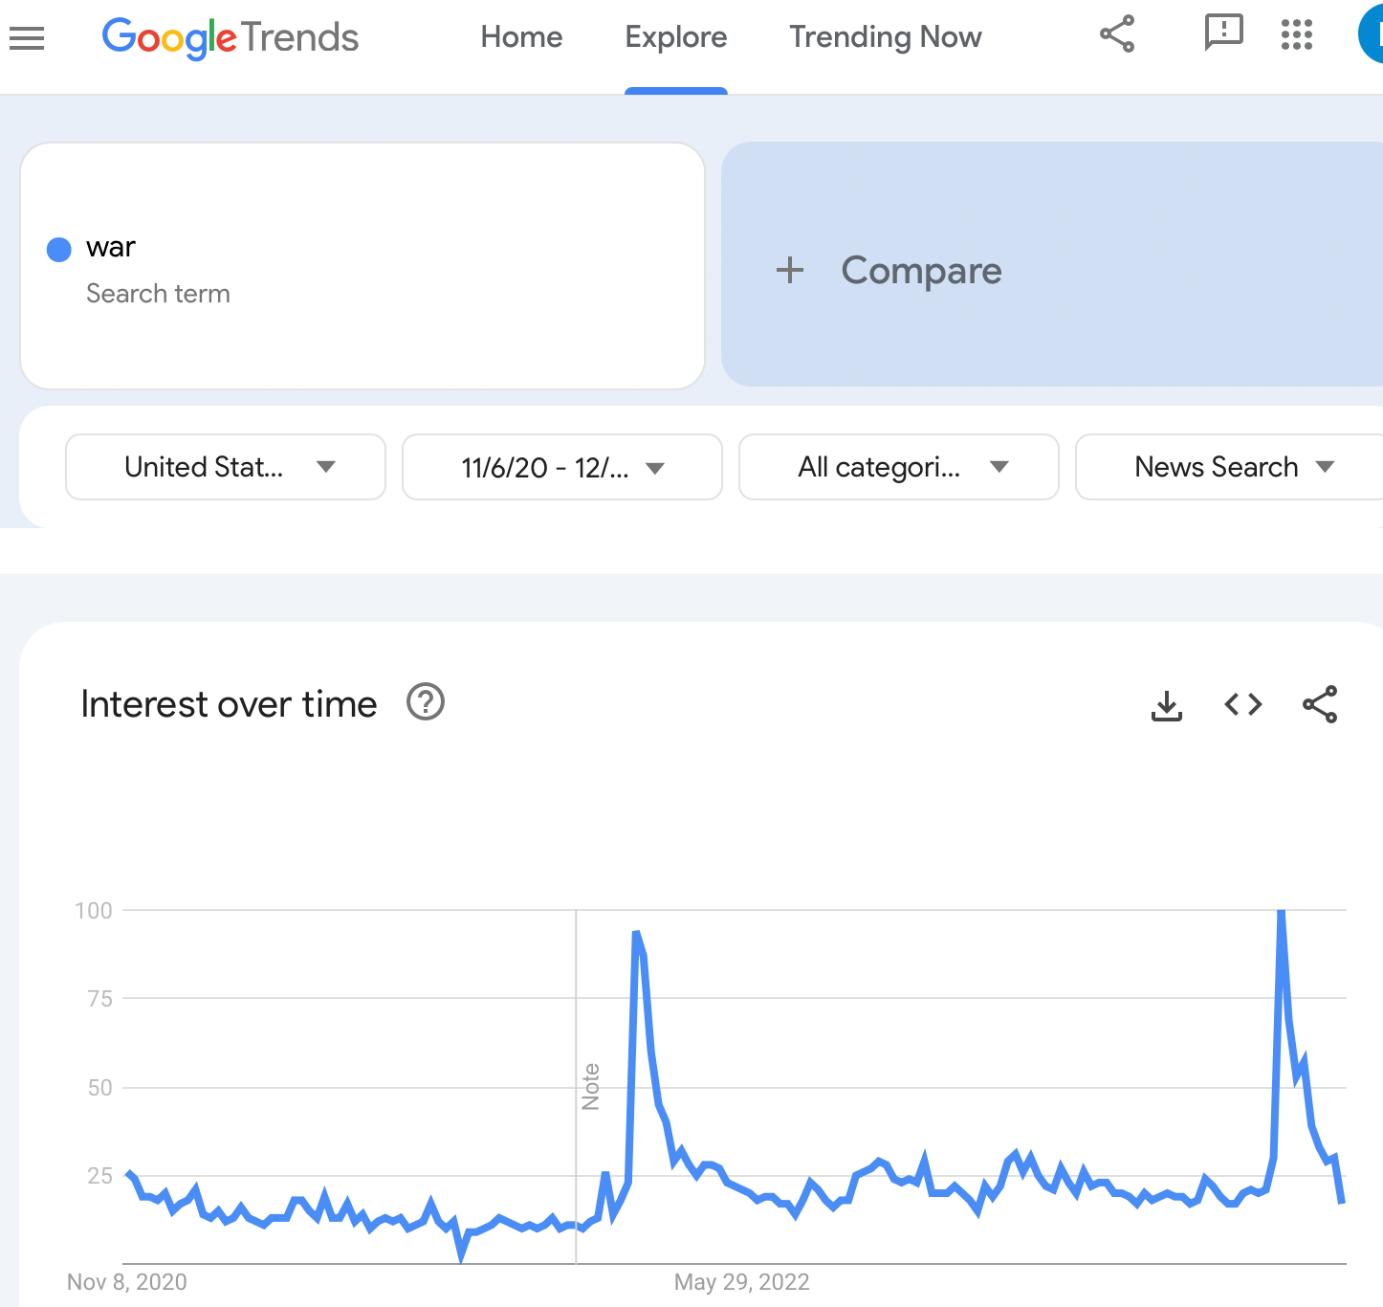
The first spike is the increase that we saw right before the Russian invasion, and the second one is based on the recent events in the Middle East.
And here’s where it gets really interesting
A pattern emerges
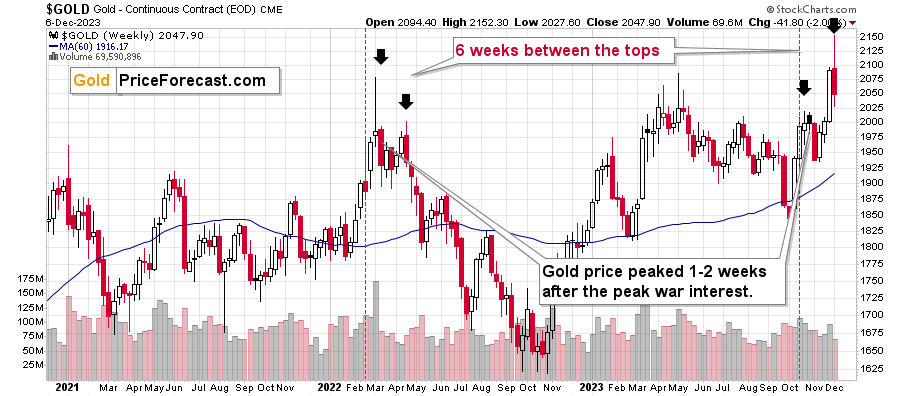
Gold topped 1-2 weeks after the above-mentioned concern peaked. That happened in early 2022, and it happened recently.
Then, back in 2022, we saw a small decline and then the gold price rallied once more before starting its huge decline.
There were six weeks between the initial and the final top, and I marked both of them with black arrows.
What happened recently?
The same thing!
Not to the letter, of course, as there are always some differences. In this case, it’s the second top that’s higher, and not the first one, like in 2022.
However, the time between both tops is once again six weeks! This is a remarkable accuracy in the analogy.
This means that the implications of the entire post-peak-concern pattern are very much up-to-date. This is huge because the follow-up action in 2022 was very significant. Gold prices declined by hundreds of dollars, and junior mining stock prices were approximately cut in half. Yes, in half.
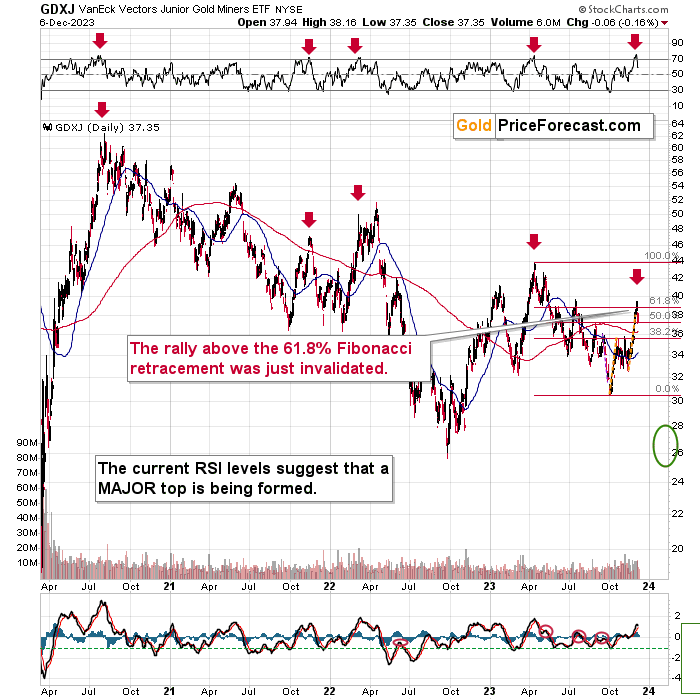
The GDXJ topped at $51.65 in April 2022, and then it bottomed at $25.67 in September, 2022, that’s over 50% lower.
The GDXJ just topped below $40… Is it possible to decline to $20? Of course, the market just has to do what it already did.
Oh, and by the way, this entire analogy doesn’t end with the precious metals market. We can see it also in stocks and in copper.
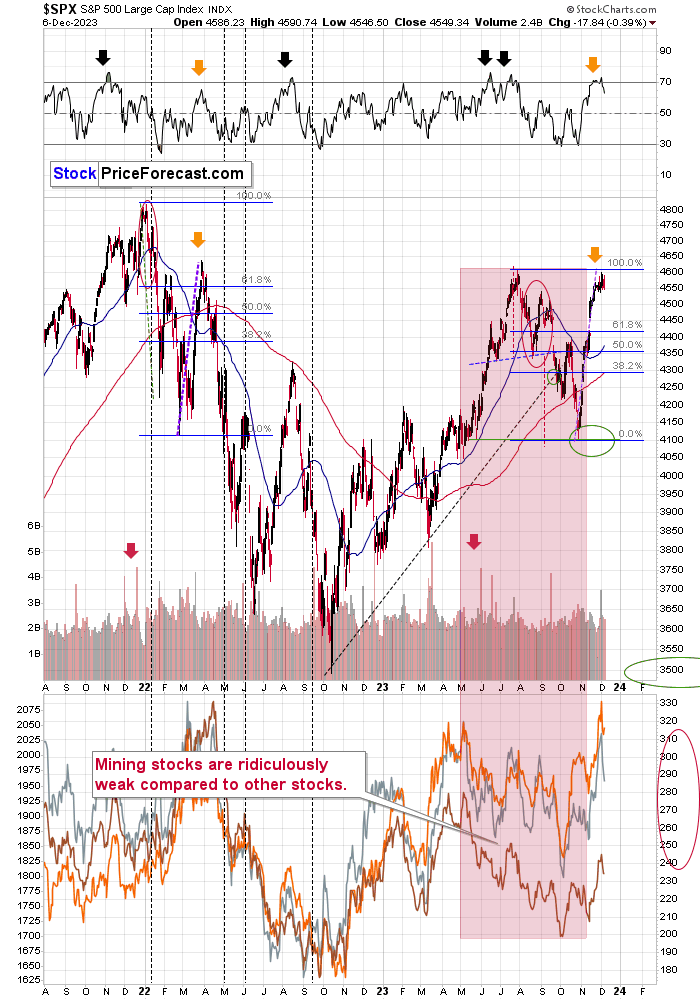
Stocks rallied sharply in Q1 and in early Q2, 2022, and even though very few people wanted to believe that back then, it was actually a major top.
Not only did we see a sharp rally in recent weeks, but it was also actually a rally of almost the identical size as the early-2022 one! The number of factors confirming this analogy is truly remarkable.
Gold’s huge invalidation and inability to hold ground above its previous high as well as miners’ relative weakness makes the situation even clearer. Yes, it’s still possible that gold would soar (and the factors that I’m looking for as bullish signs remain as previously), but a huge decline here is much more likely. And it can be a very lucrative move for those who position themselves ahead of the big price moves.
Want free follow-ups to the above article and details not available to 99%+ investors? Sign up to our free newsletter today!
Want free follow-ups to the above article and details not available to 99%+ investors? Sign up to our free newsletter today!
Author

Przemyslaw Radomski, CFA
Sunshine Profits
Przemyslaw Radomski, CFA (PR) is a precious metals investor and analyst who takes advantage of the emotionality on the markets, and invites you to do the same. His company, Sunshine Profits, publishes analytical software that any


