The markets say up
USD: Sept '24 is Down at 101.665.
Energies: Sept '24 Crude is Up at 73.89.
Financials: The Sept '24 30 Year T-Bond is Down 9 ticks and trading at 123.29.
Indices: The Sept '24 S&P 500 emini ES contract is 10 ticks Lower and trading at 5575.75.
Gold: The Dec'24 Gold contract is trading Up at 2561.40.
Initial conclusion
This is not a correlated market. The USD is Down and Crude is Up which is normal, and the 30 Year T-Bond is trading Down. The Financials should always correlate with the US dollar such that if the dollar is Higher, then the bonds should follow and vice-versa. The S&P is Higher and Crude is trading Higher which is not correlated. Gold is trading Higher which is correlated with the US dollar trading Down. I tend to believe that Gold has an inverse relationship with the US Dollar as when the US Dollar is down, Gold tends to rise in value and vice-versa. Think of it as a seesaw, when one is up the other should be down. I point this out to you to make you aware that when we don't have a correlated market, it means something is wrong. As traders you need to be aware of this and proceed with your eyes wide open. Asia trading mainly Mixed. All of Europe is trading mainly Lower except the Paris exchange.
Possible challenges to traders
-
FOMC Member Bostic Speaks at 1:35 PM EST. This is Major.
-
FOMC Member Barr Speaks at 2:45 M EST. This is Major.
Traders, please note that we've changed the Bond instrument from the 10 year (ZN) to the 2 year (ZT). They work exactly the same.
We've elected to switch gears a bit and show correlation between the 10-year Treasury notes (ZN) and the S&P futures contract. The YM contract is the Dow Jones Industrial Average, and the purpose is to show reverse correlation between the two instruments. Remember it's likened to a seesaw, when up goes up the other should go down and vice versa.
Yesterday the ZT migrated Lower at around 8:30 AM EST. If you look at the charts below the ZT gave a signal at around 8:30 AM with no real economic news in sight and started its Downward slide. Look at the charts below and you'll see a pattern for both assets. The Dow moved Higher at 8:30 AM and the ZT moved Lower at around the same time. These charts represent the newest version of BarCharts, and I've changed the timeframe to a 15-minute chart to display better. This represented a Short opportunity on the 2-year note, as a trader you could have netted about 20 ticks per contract on this trade. Each tick is worth $7.625. Please note: the front month for ZT is Sept and the Dow is now Sept '24. I've changed the format to filled Candlesticks (not hollow) such that it may be more apparent and visible.
Charts courtesy of Barcharts
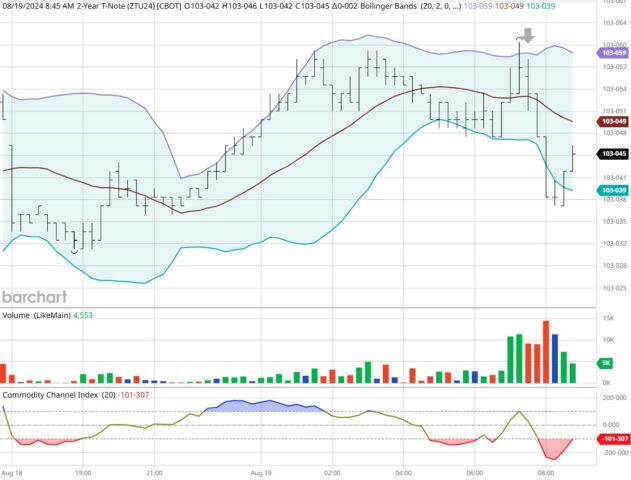
ZT -Sept 2024 - 08/19/24
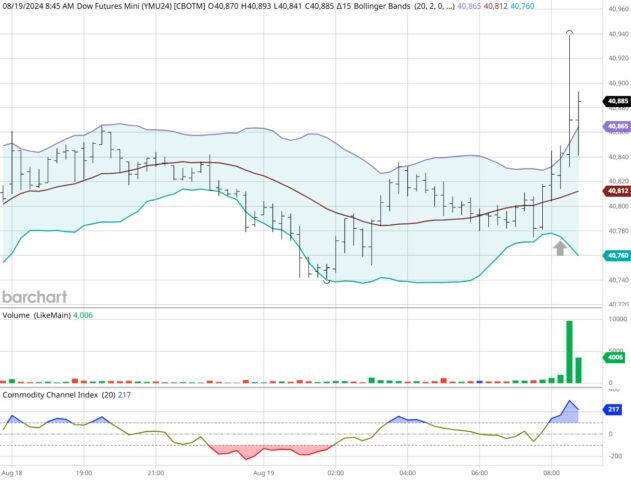
Dow - Sept 2024- 08/19/24
Bias
Yesterday we gave the markets a Mixed or Neutral bias as we didn't see any semblance of Market Correlation. The markets had other ideas as the Dow gained 237 points and the other indices gained ground as well. Today we aren't dealing with a correlated market and our bias is to the Upside.
Could this change? Of Course. Remember anything can happen in a volatile market.
Commentary
Yesterday when we first looked at the markets, we saw no semblance of Market Correlation and suggested a Mixed or Neutral bias, meaning the markets could go anywhere and often does. The markets migrated to the Upside. We think the reason for this is because today is Day One of the Democratic National Convention. Say what you will the Dems are doing better these past couple of weeks as Kamala has managed to galvanize and unite the Democrats versus the GOP. There are even some polls that suggest she is ahead of former President Trump. I never thought I'd see that but there we have it. The markets seem to like it as well because they have gone higher even when there is no apparent reason to do so. Today we only have two FOMC members speaking at different times. That is, it for economic news. Will this be enough to keep the markets moving in an upward trend? Only time will tell...
Author

Nick Mastrandrea
Market Tea Leaves


