The markets once again continued their upside ways yesterday

USD: Dec '24 is Up at 100.205.
Energies: Nov '24 Crude is Down at 70.65.
Financials: The Dec '24 30 Year T-Bond is Down 14 ticks and trading at 124.19.
Indices: The Dec '24 S&P 500 emini ES contract is 14 ticks Lower and trading at 5788.50.
Gold: The Dec'24 Gold contract is trading Up at 2681.40.
Initial conclusion
This is not a correlated market. The USD is Up and Crude is Down which is normal, but the 30 Year T-Bond is trading Lower. The Financials should always correlate with the US dollar such that if the dollar is Higher, then the bonds should follow and vice-versa. The S&P is Lower and Crude is trading Lower which is not correlated. Gold is trading Higher which is not correlated with the US dollar trading Up. I tend to believe that Gold has an inverse relationship with the US Dollar as when the US Dollar is down, Gold tends to rise in value and vice-versa. Think of it as a seesaw, when one is up the other should be down. I point this out to you to make you aware that when we don't have a correlated market, it means something is wrong. As traders you need to be aware of this and proceed with your eyes wide open. Currently Asia is trading Higher with the exception of the Singapore and Nikkei exchanges. Europe is trading Higher with the exception of the German Dax and Paris exchanges.
Possible challenges to traders
-
New Home Sales is out at 10 AM EST. This is Major.
-
Crude Oil Inventories is out at 10:30 AM EST. This is Major.
-
FOMC Member Kugler Speaks at 4 PM EST. This is not Major as it after market hours.
Traders, please note that we've changed the Bond instrument from the 10 year (ZN) to the 2 year (ZT). They work exactly the same.
We've elected to switch gears a bit and show correlation between the 2-year Treasury notes (ZT) and the S&P futures contract. The YM contract is the Dow Jones Industrial Average, and the purpose is to show reverse correlation between the two instruments. Remember it's likened to a seesaw, when up goes up the other should go down and vice versa.
Yesterday the ZT migrated Lower at around 8 AM EST with no real economic news released and began its Downward slide. Look at the charts below and you'll see a pattern for both assets. The Dow moved Higher at 8 AM and the ZT moved Lower at around the same time. These charts represent the newest version of Bar Charts, and I've changed the timeframe to a 15-minute chart to display better. This represented a Short opportunity on the 2-year note, as a trader you could have netted about 20 ticks per contract on this trade. Each tick is worth $7.625. Please note: the front month for ZT is Dec and the Dow is still Sept '24. I've changed the format to filled Candlesticks (not hollow) such that it may be more apparent and visible.
Charts courtesy of Barcharts
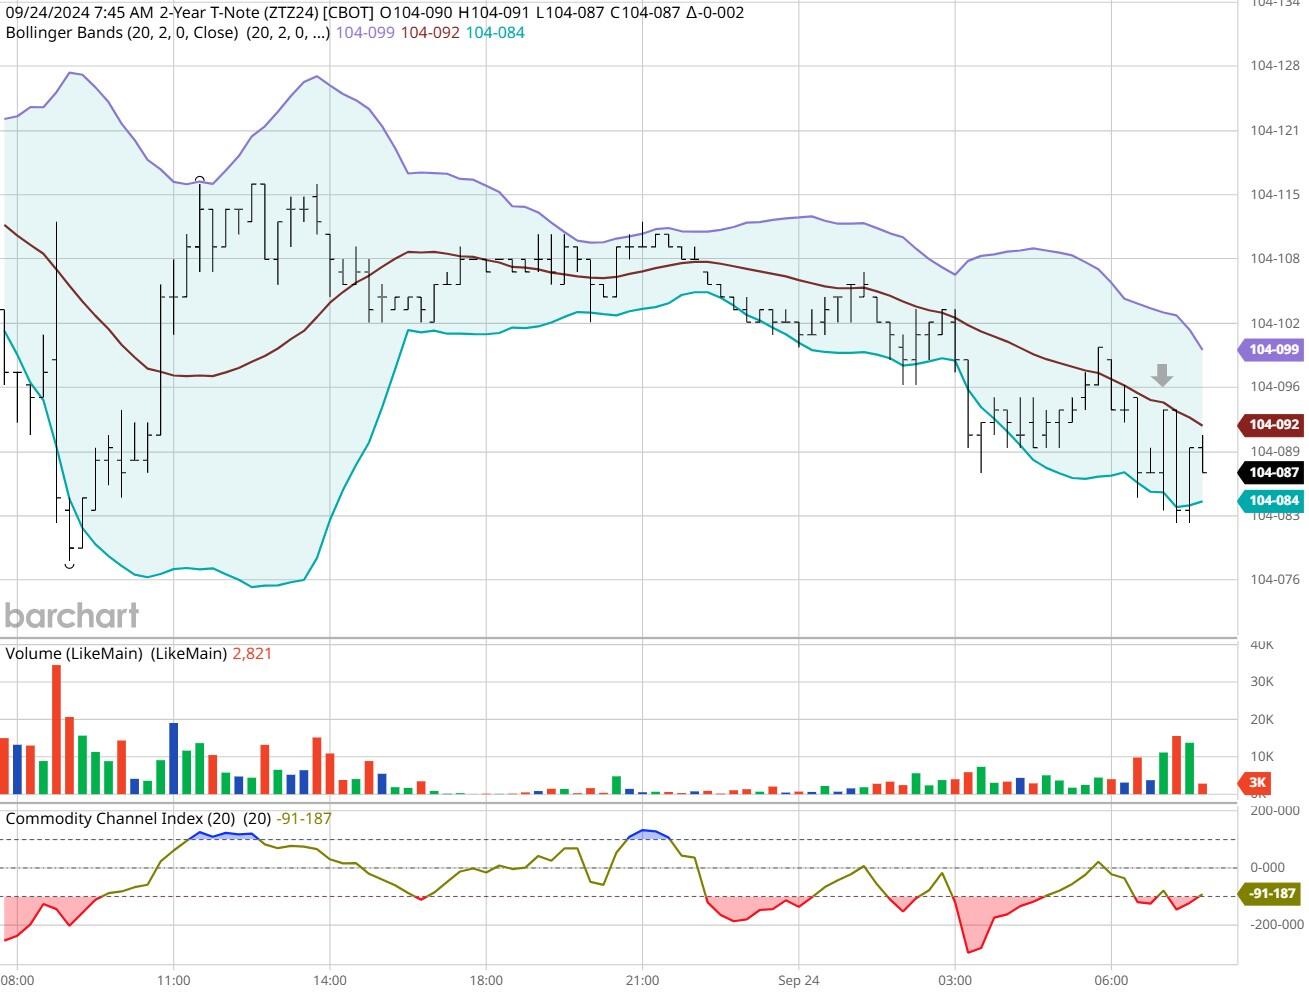
ZT -Dec 2024 - 09/24/24
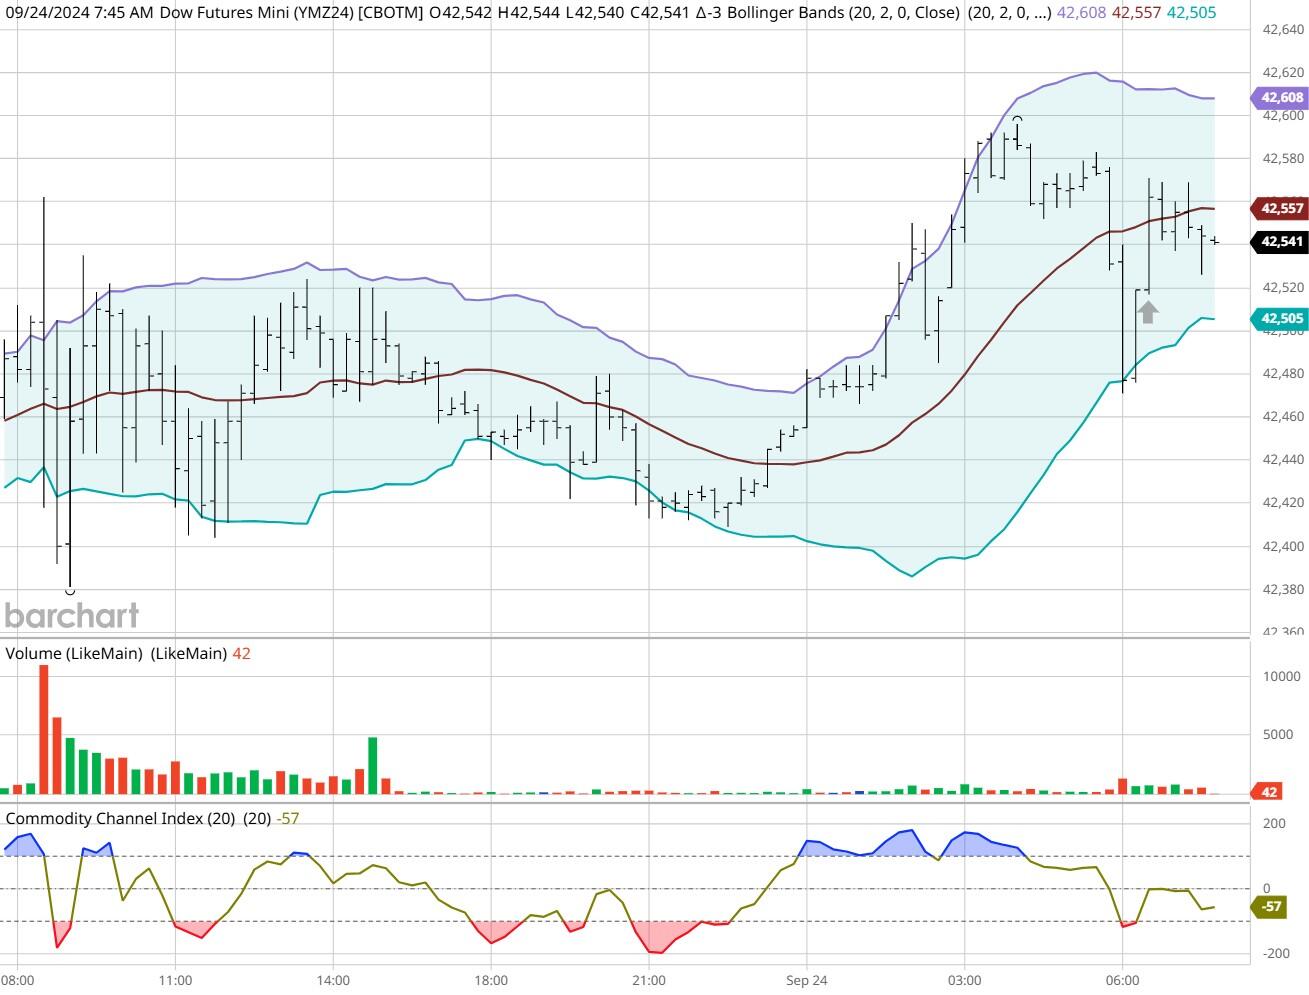
Dow - Dec 2024- 09/24/24
Bias
Yesterday we gave the markets an Upside bias as both the USD and the Bonds were trading Lower Tuesday morning, and this usually reflects an Upside Day. The markets didn't disappoint as the Dow gained 84 points and the other indices gained ground as well. Today we aren't dealing with a correlated market and our bias is Neutral or Mixed.
Could this change? Of Course. Remember anything can happen in a volatile market.
Commentary
So, the markets once again continued their Upside ways yesterday as the indices rose Higher. From our perspective we will just continue to follow our rules for Market Correlation as they continue to serve us. Will this trend continue? As in all things only time will tell.
Author

Nick Mastrandrea
Market Tea Leaves


