The major indices continue much higher into a morning high of the day – Then trade in a narrow range
Recap 10/17 - The S&P opened with a 57 handle gap up and then traded another 49 handles higher into a 10:21 AM high of the day. From that high, the S&P declined 33 handles into an 11:16 AM low. From that low, the S&P rallied 29 handles into a 12:10 PM high. From that high, the S&P traded into a narrow 15 handle sideways range, culminating with a 10 handle pullback into the close.
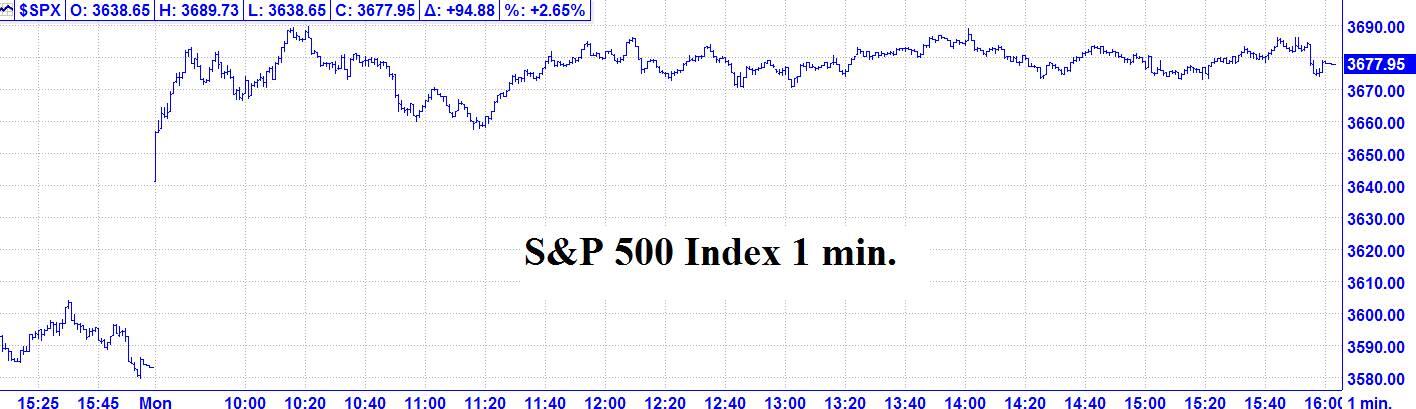
10/17 – The major indices, following a big gap up opening, continued much higher into a morning high of the day and then traded mostly in a narrow sideways range for the rest of the day to finish with a huge up day per the following closes: DJIA + 550.99; S&P 500 + 94.88; and the Nasdaq Comp. + 354.41.
Looking ahead – The next change in trend point 10/18 via Market Math and the next major change in trend is due 10/19 AC. Please see below.
The Now Index is in the NEUTRAL ZONE.
Coming events
(Stocks potentially respond to all events).
3. A. 10/19 AC – Mars 0 North Latitude. Major change in trend Corn, Gold, OJ.
B. 10/21 AC – Saturn in Aquarius turns Direct. Major change in trend Coffee, Copper.
C. 10/24 AC – New Moon – Solar Eclipse in Scorpio. Major change in trend Financials, Grains, Precious Metals, Cocoa, Hogs, T-Bonds. D. 10/27 AC – Jupiter Retro Leaves Aries and enters Pisces. Change in trend Coffee, Corn, C.I., Gold, Oats, OJ, Oil, Sugar, Wheat.
E. 10/28 AC – Uranus 45 US Venus. Moderate change in trend US Stocks, T-Bonds, US Dollar. F. 10/28 AC – Mars in Gemini turns Retrograde. Major change in trend Stocks.
Market Math
10/18 = 287 (Music) days > 1/04/2022 MAJOR HIGH
10/20 = 289 (13^) days > 1/04/2022 MAJOR HIGH
Fibonacci – 10/18, 10/21, 10/24
Astro – 10/20, 10/24, 10/28 AC
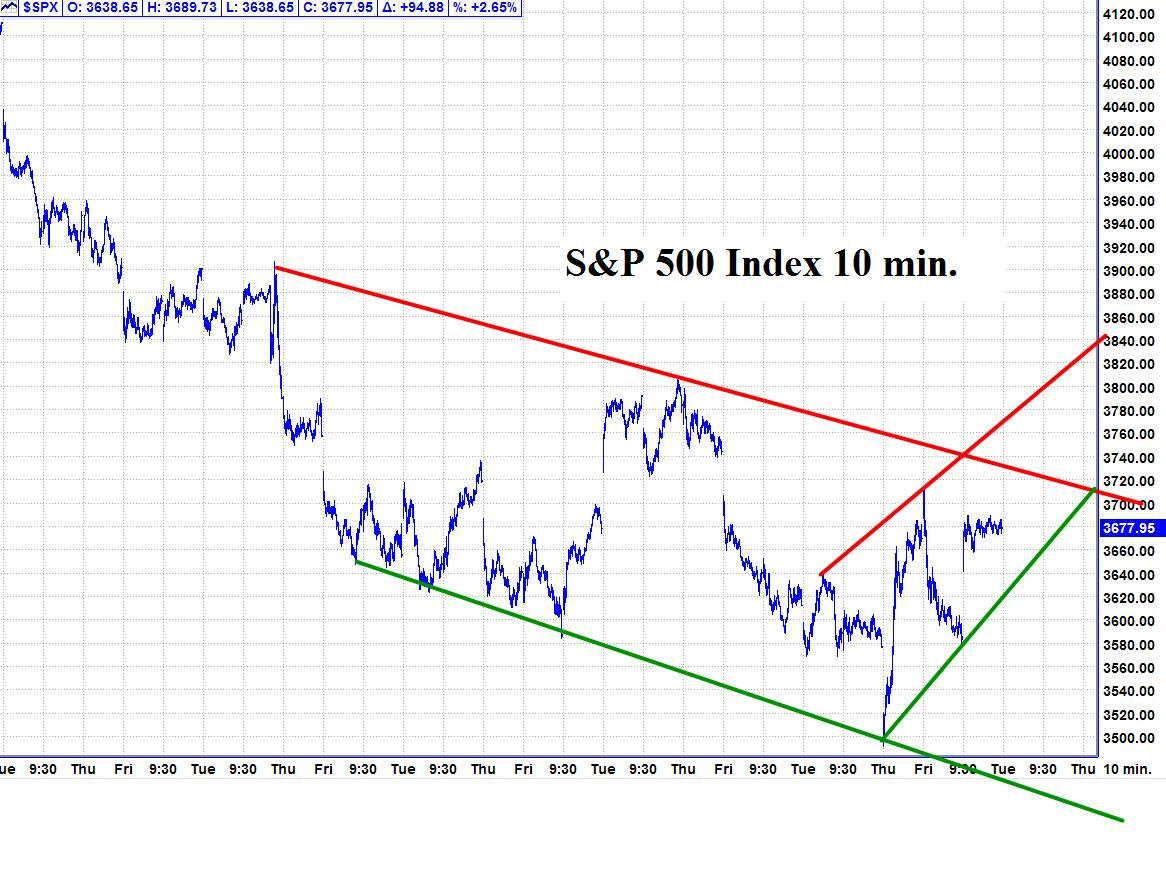
Please see below the S&P 500 10 minute chart.
Support - 3650, 3580 Resistance – 3730.
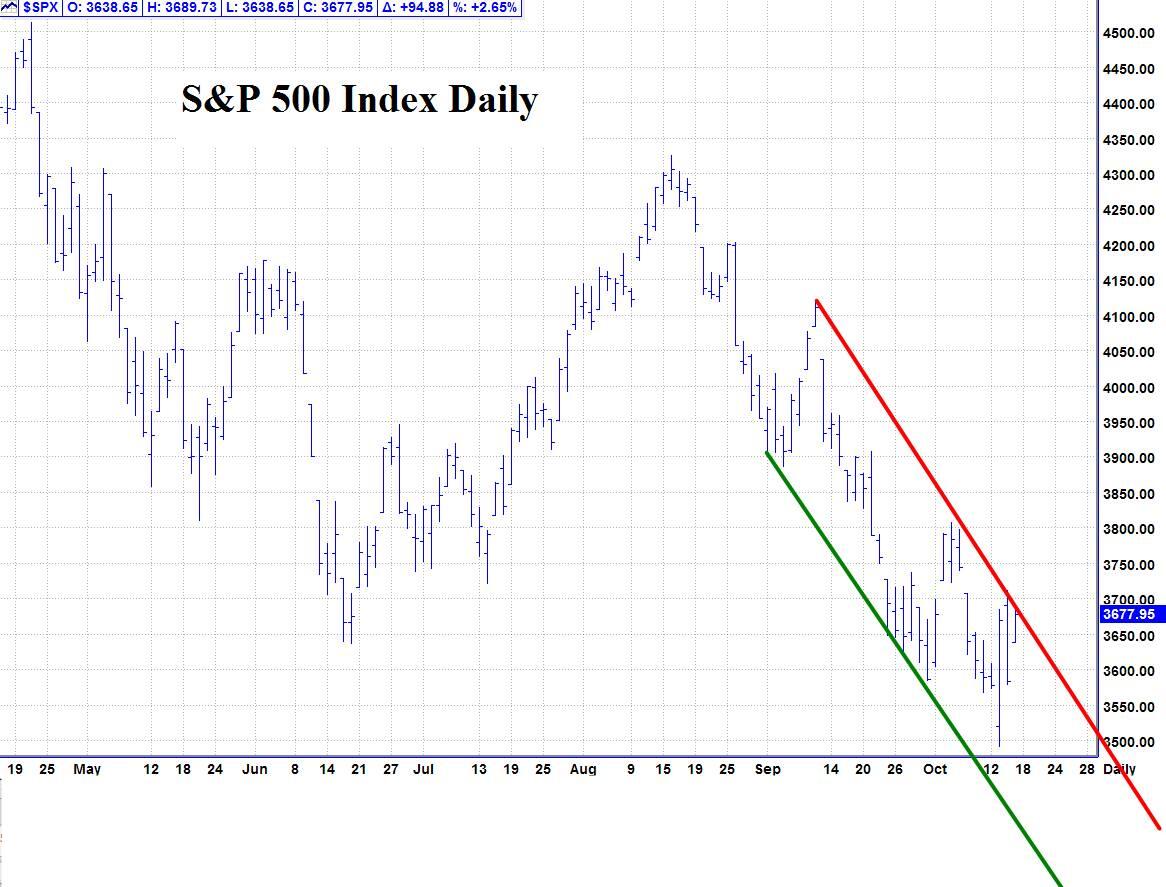
Please see below the S&P 500 Daily chart.
Support - 3650, 3580 Resistance – 3730. 3750.
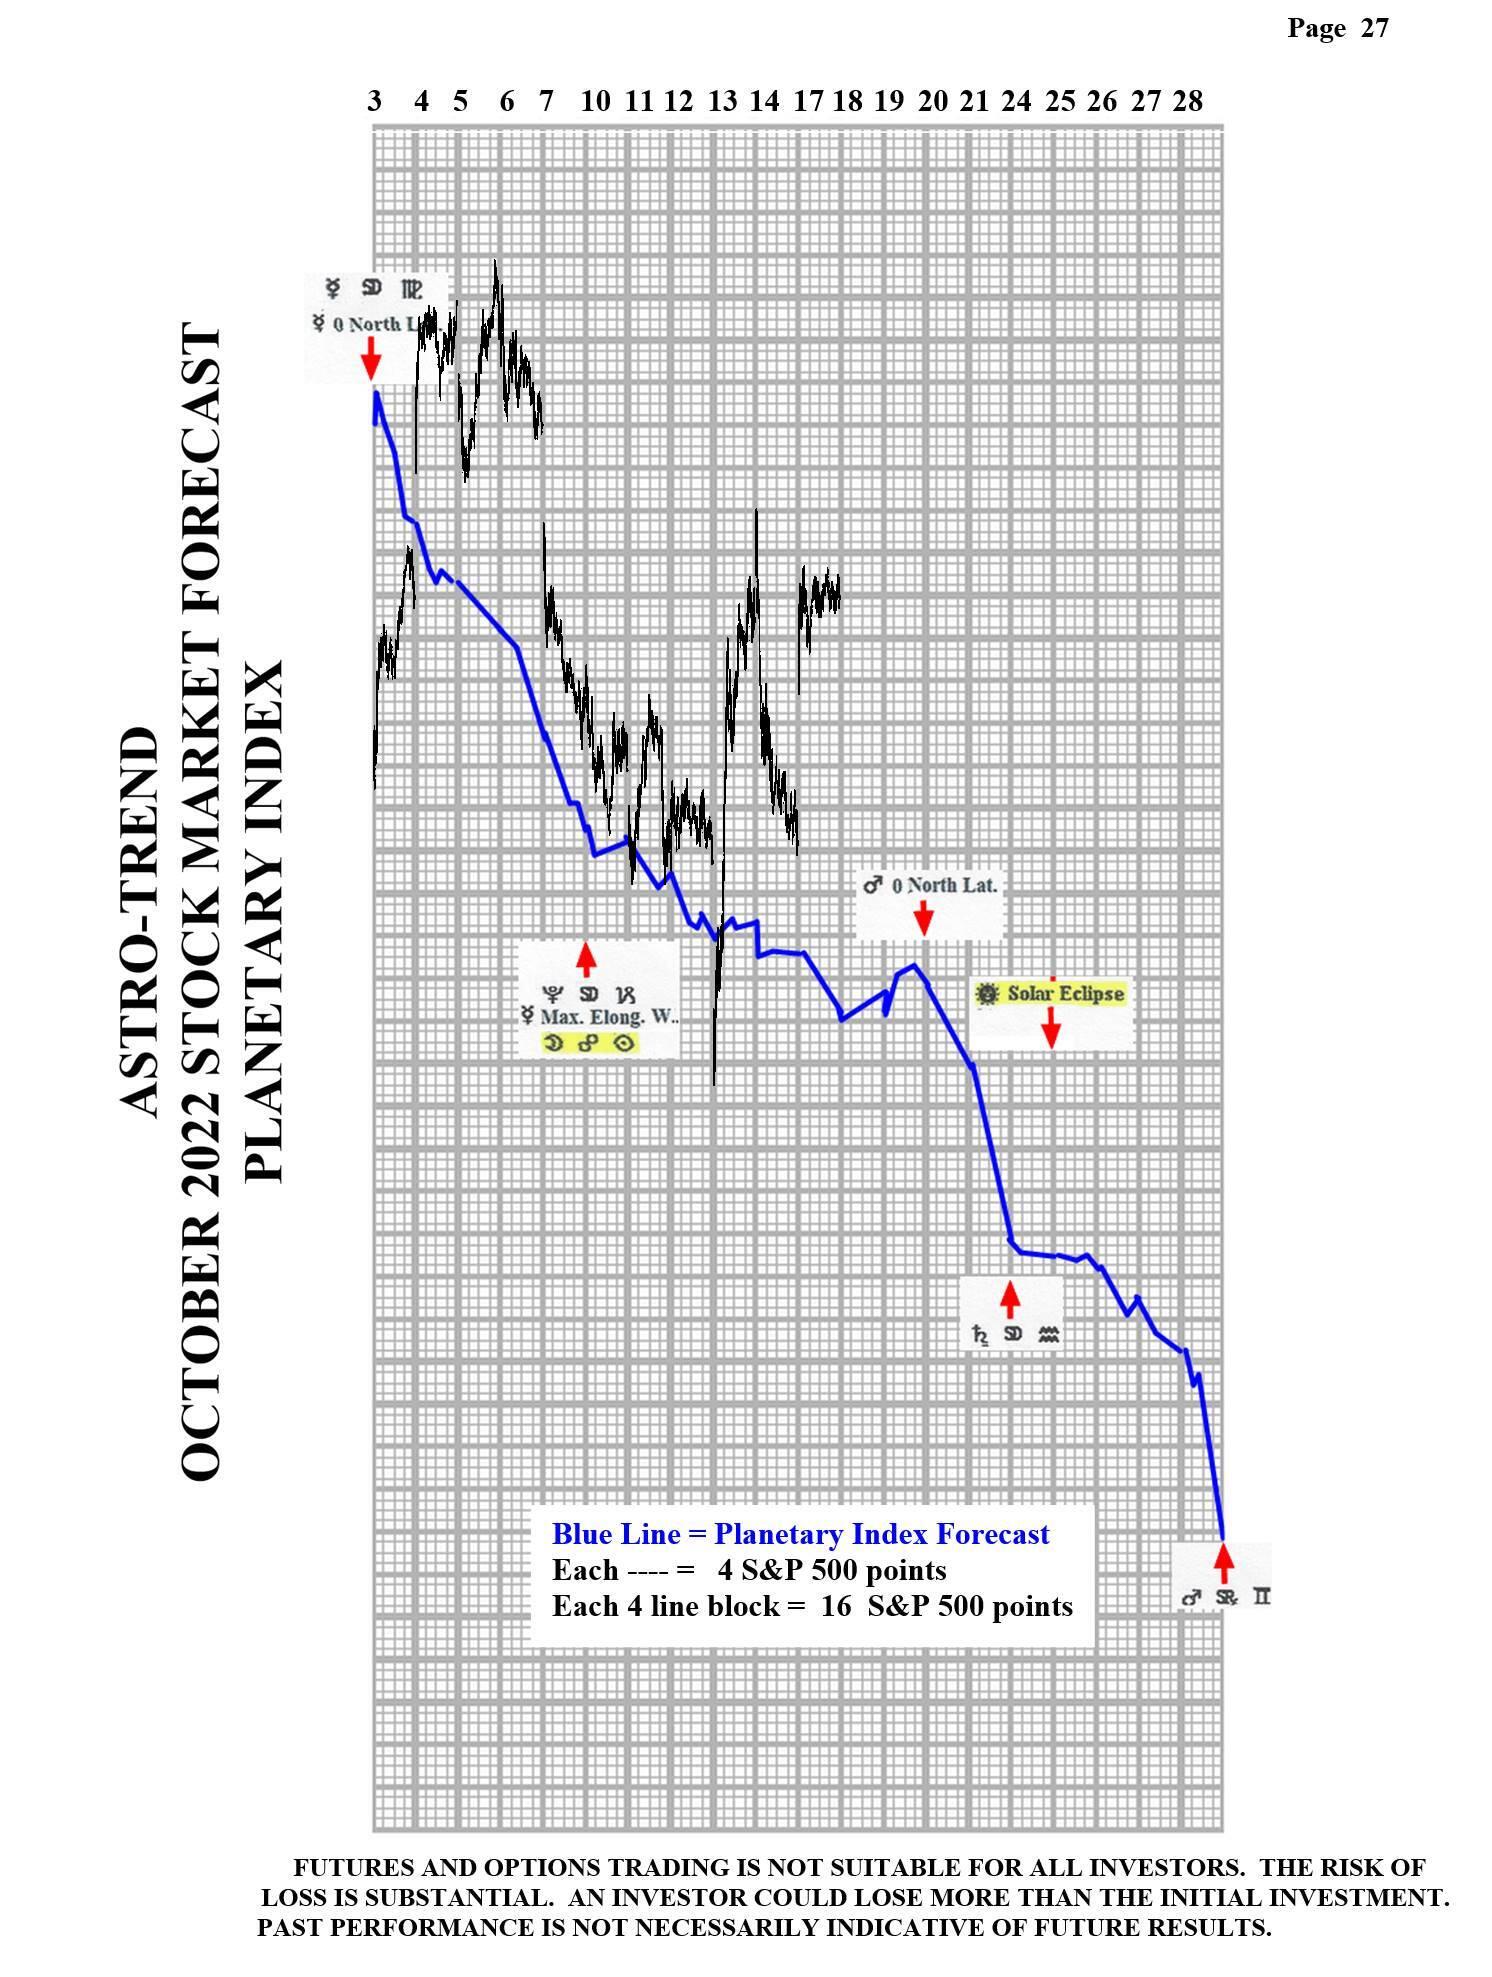
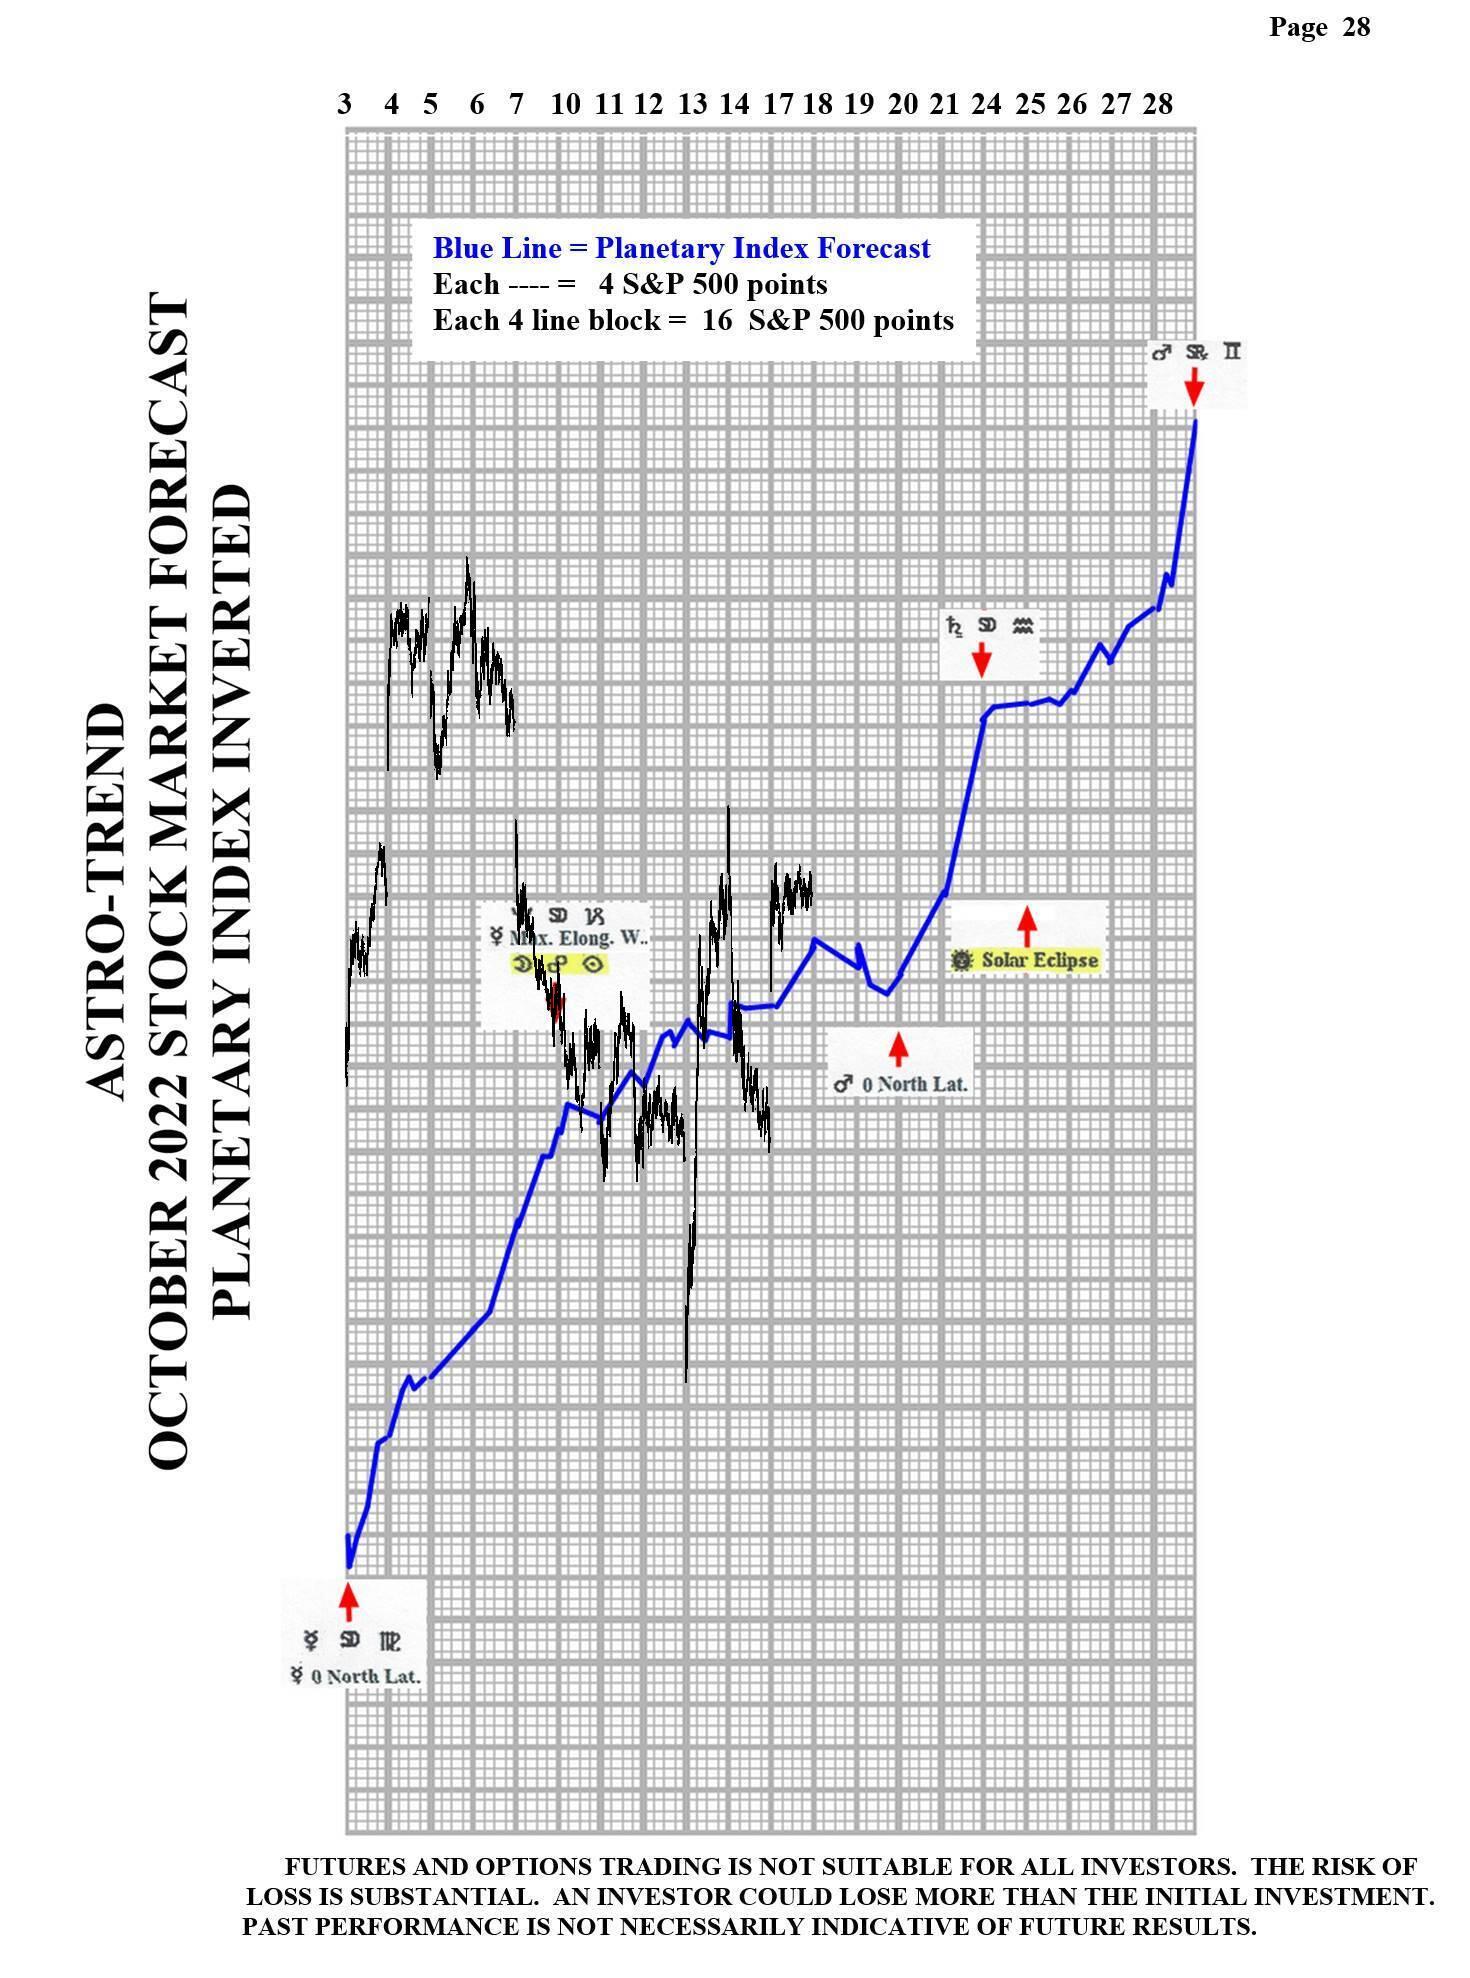
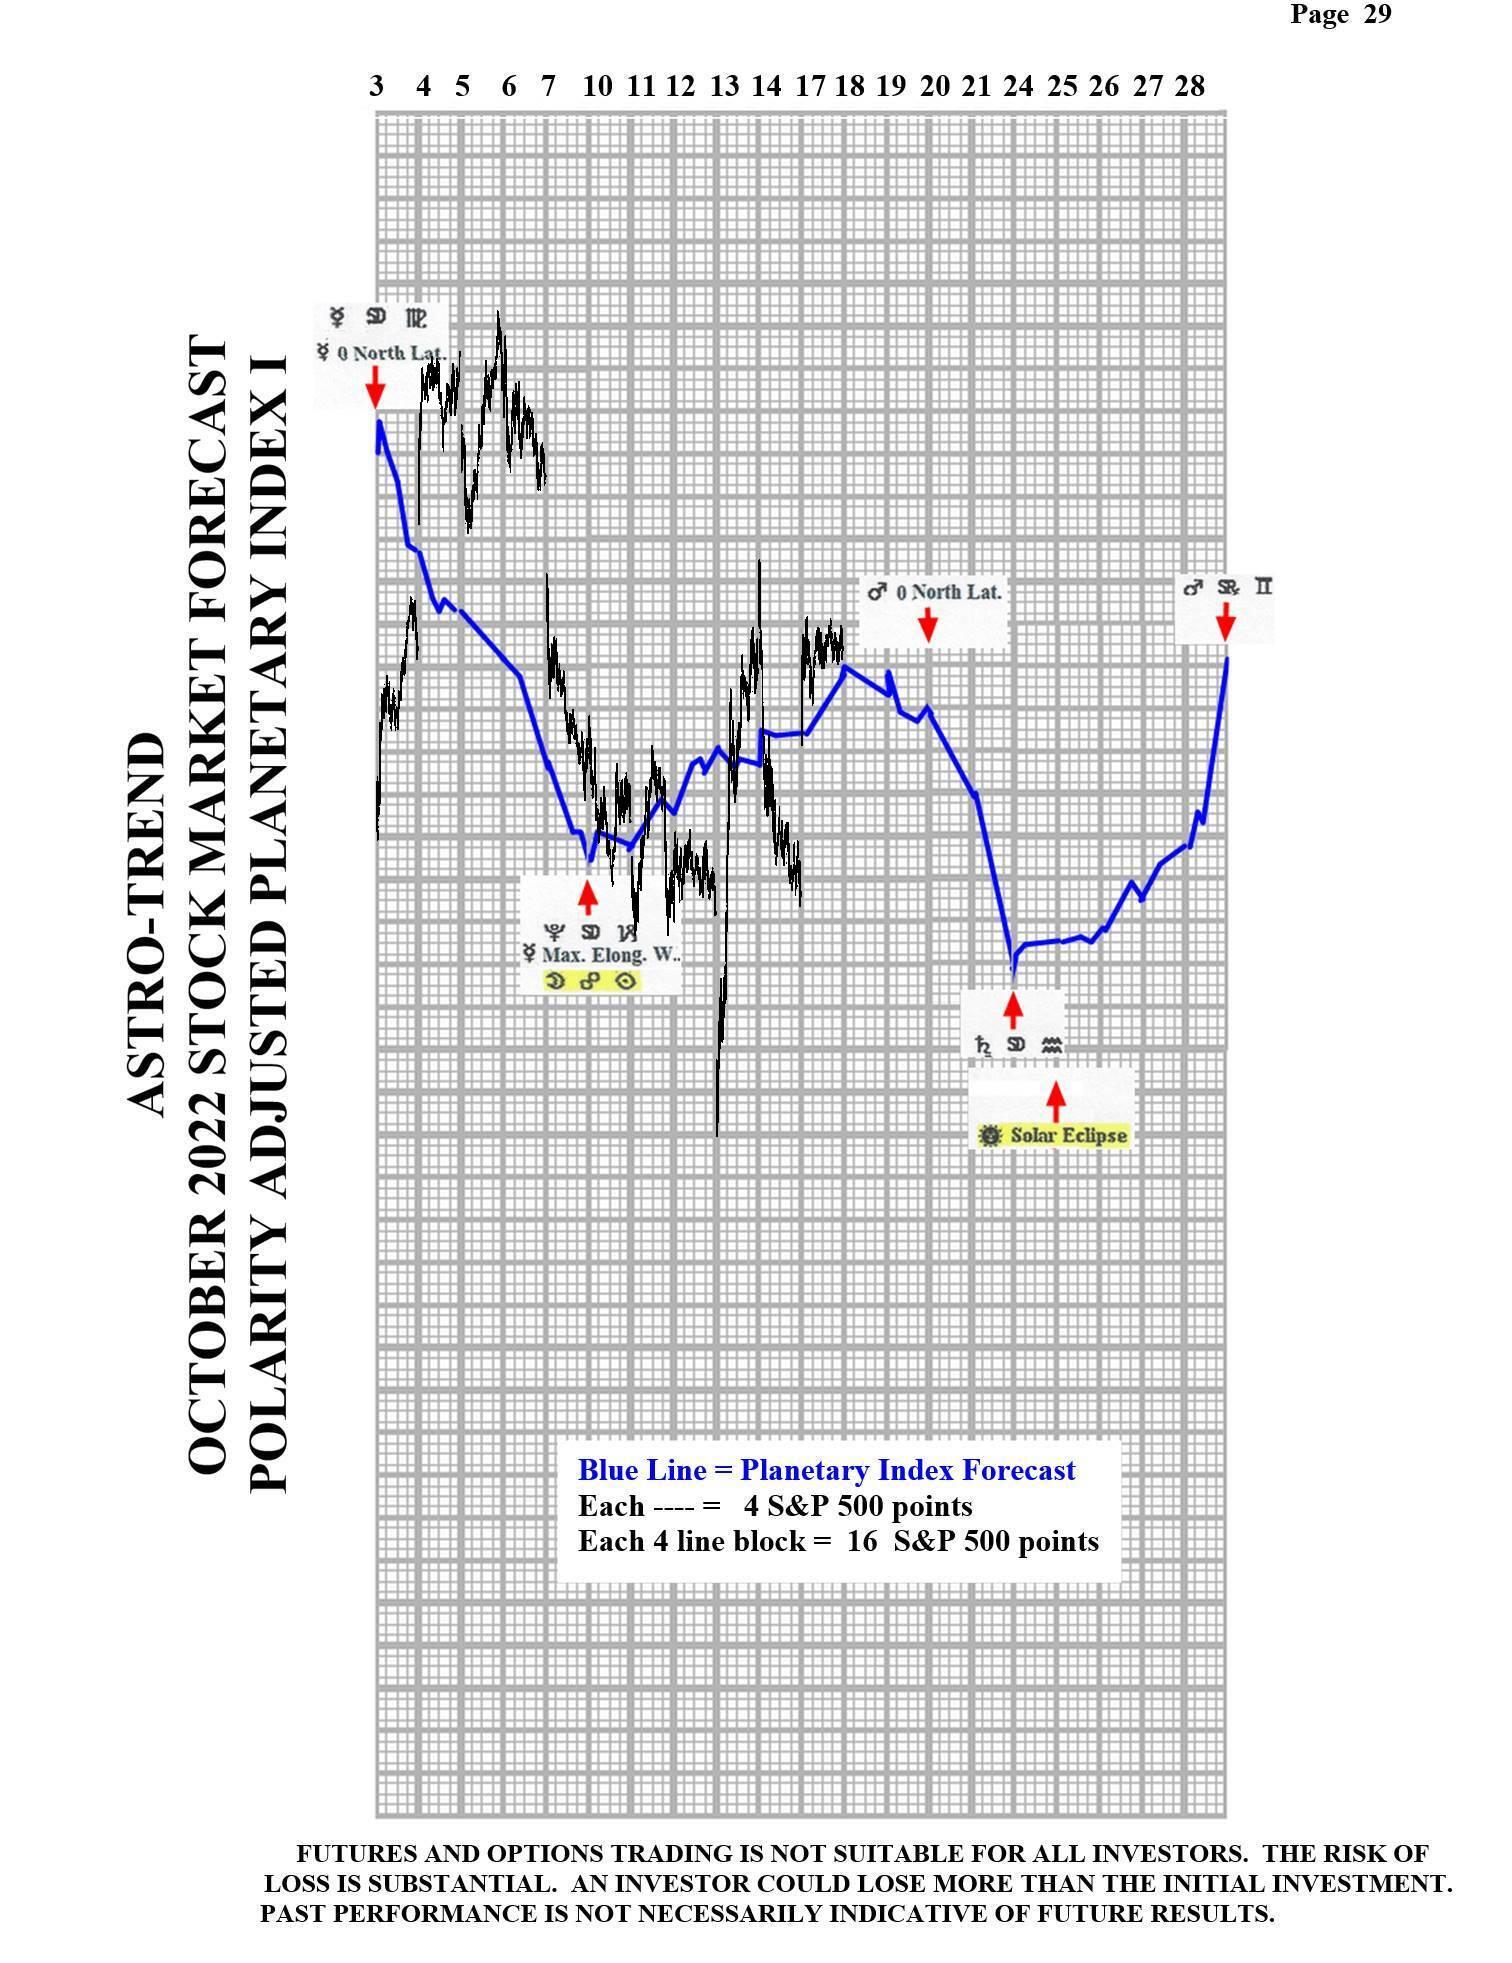
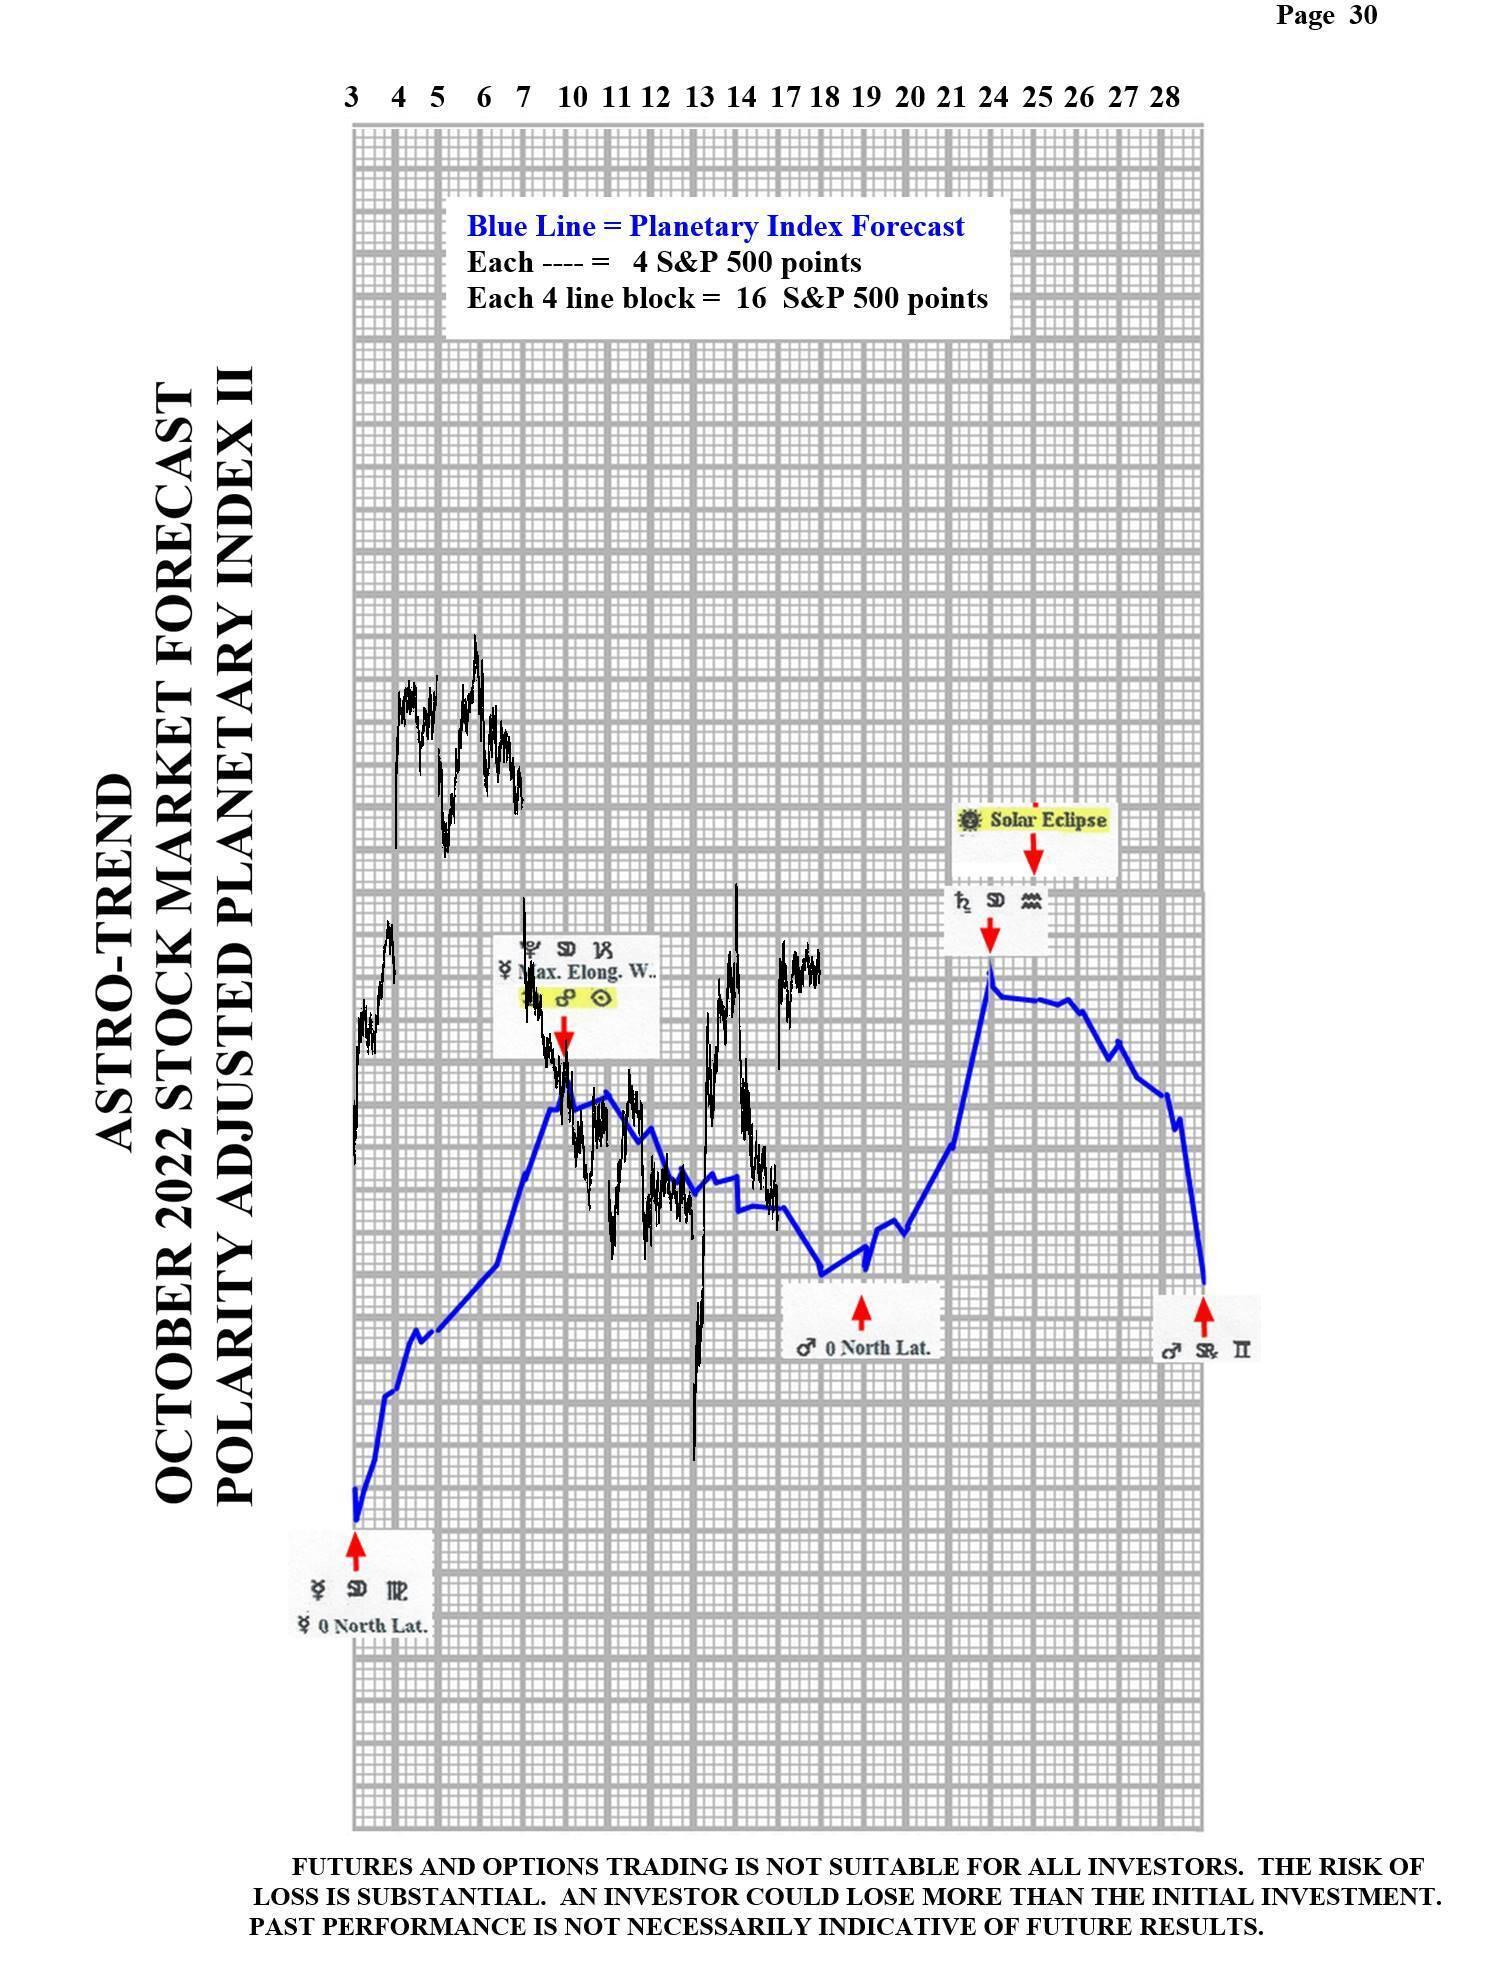
Please see below the October Planetary Index charts with S&P 500 10 minute bars for results.
Author

Norm Winski
Independent Analyst
www.astro-trend.com


