The Liberation day is here: What to expect from Gold and Copper

The Phi number, copper’s invalidation, and USDX’s turning point tell a story…
Yesterday’s analysis generated quite a sizable response (as per our email inbox) and I’m not surprised. Gold moving to its key Fibonacci-extension-based (a.k.a. Phi-based) target and then reversing is indeed a major development. I described it in detail yesterday, so I don’t want to repeat myself, but I’d like to discuss how the calculations work, as this seems to be confusing. Quoting one of the questions that I received:
I am a Fibonacci fan, but I don't understand how you arrived at the gold price of 3,140 using the extension from the end of 2015 to 2020. Based on the calculation of $1,000 × 1.618, you get 1,618, not 3,140. Can you please explain?
And as a reminder, here’s the chart featuring this technique:
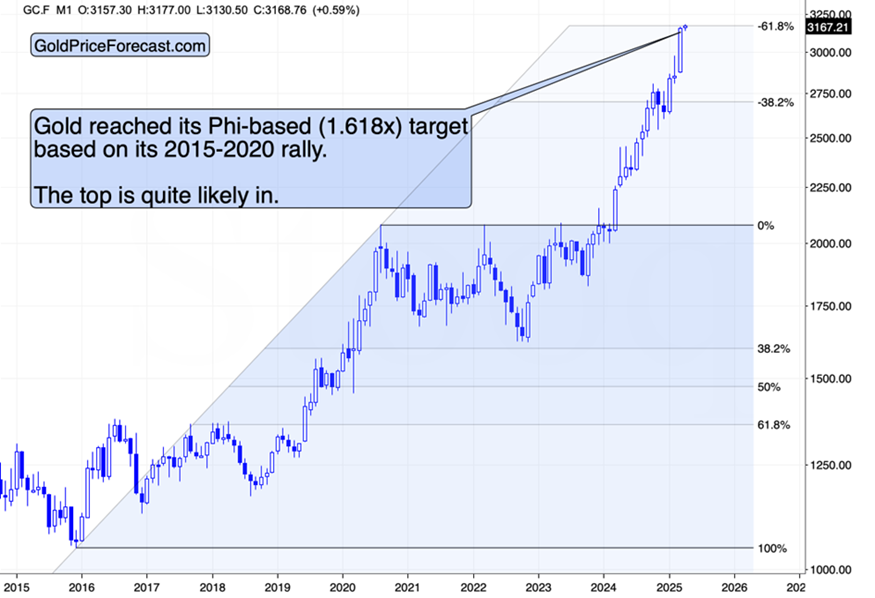
My reply is that the basis for the multiplication (by 1.618) is not the $1,000 value, but the size of the previous rally – that’s what’s marked on the chart with a blue shade.
The rally started at $1,045.40 (the 2015 low) and it ended in mid-2020 at $2,078.
Since this chart is based on a logarithmic scale, it’s the relative price change that matters, not the absolute/nominal one.
Here's how it works with the logarithmic scale:
1. Starting point: The 2015 low of $1,045.40
2. Reference high point: The mid-2020 high of $2,078
The ratio between them: $2,078 / $1,045.40 = 1.988
Now, let's raise this ratio to the power of 1.618: 1.988^1.618 ≈ 3.03
Then, to find our target price: $1,045.40 x 3.03 ≈ $3,167.56
That gives us $3,167.56, which rounds to the $3,167 target shown on the chart.
Having said that, let’s move to what the markets are providing us with today.
The ADP Nonfarm Employment numbers were much better than expected, but it doesn’t seem that anyone is paying attention to that. Instead, everyone is holding their breath awaiting Trump’s comments on tariffs. Since they are scheduled right when the markets close, today’s session can be described as “peak uncertainty”.
This might also mean “peak gold” as gold serves as the safe haven. The way miners and silver perform today confirms this (just as the previously mentioned long-term Fibonacci-extension-based target does).
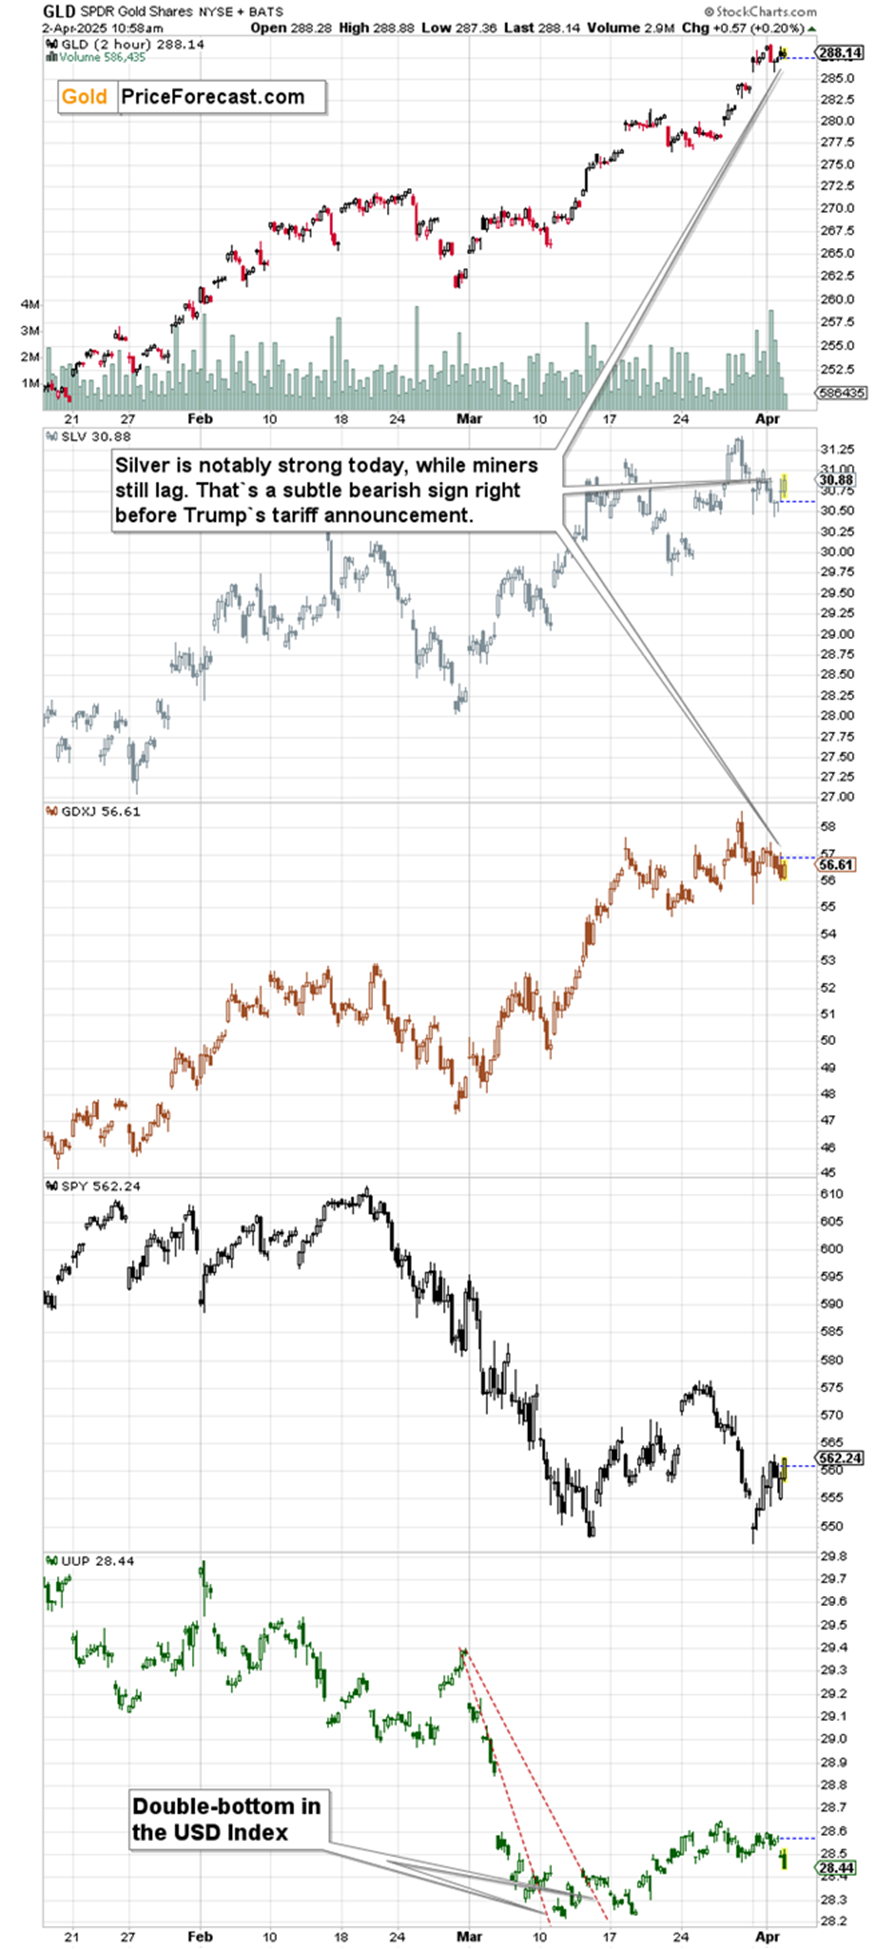
Silver is up more than gold – outperforming it on an immediate-term basis. At the same time, miners are down. This is a classic short-term sell signal.
Copper is taking a breather while FCX (copper and gold producer) is down, once again proving its weakness.
What’s likely to happen after the tariffs are announced? One thing is that the uncertainty will likely decline (which might be like releasing a handbrake on gold’s decline). The other thing is that we’ll likely have the price moves that are opposite to what seems likely given the announcement, due to the buy-the-rumor-sell-the-fact phenomenon.
You see, markets often move on the rumor and reverse based on the fact. Gold and copper seem to have rallied based on the rumor that the tariffs are going to be increased today (which Trump called the “Liberation Day”). The above rule suggests that those moves can now reverse, and this would perfectly align with long-term technical charts for both: gold and copper.
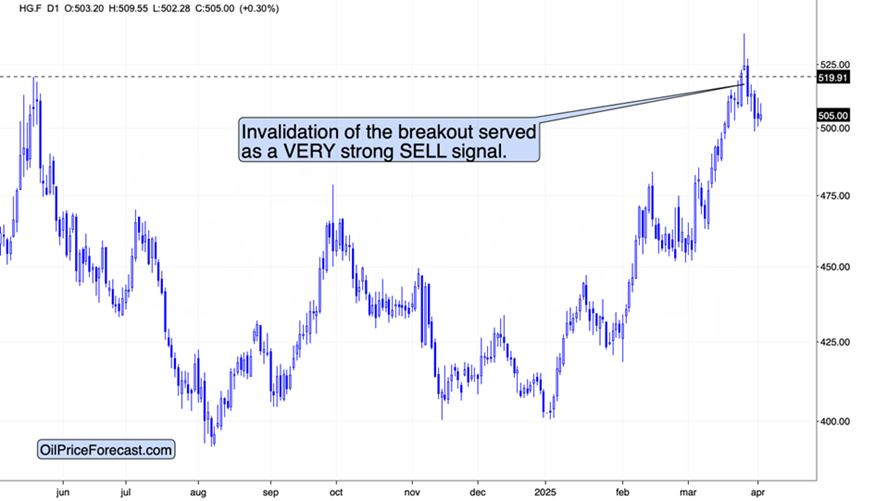
As a reminder, the latter recently invalidated its move to new highs, which was a strong sell signal. Its implications haven’t played out yet – probably due to the “Liberation-Day-based” uncertainty.
In case of stocks and the USD Index, we saw declines based on the tariff announcements and threats. This made sense for stocks (this is fundamentally bearish for the world trade and pretty much all stock markets, but it’s particularly damaging to the U.S. economy; without taking any political implications into consideration), but not for the USD Index (as I’ve shown, tariffs have positive impact on the U.S. dollar).
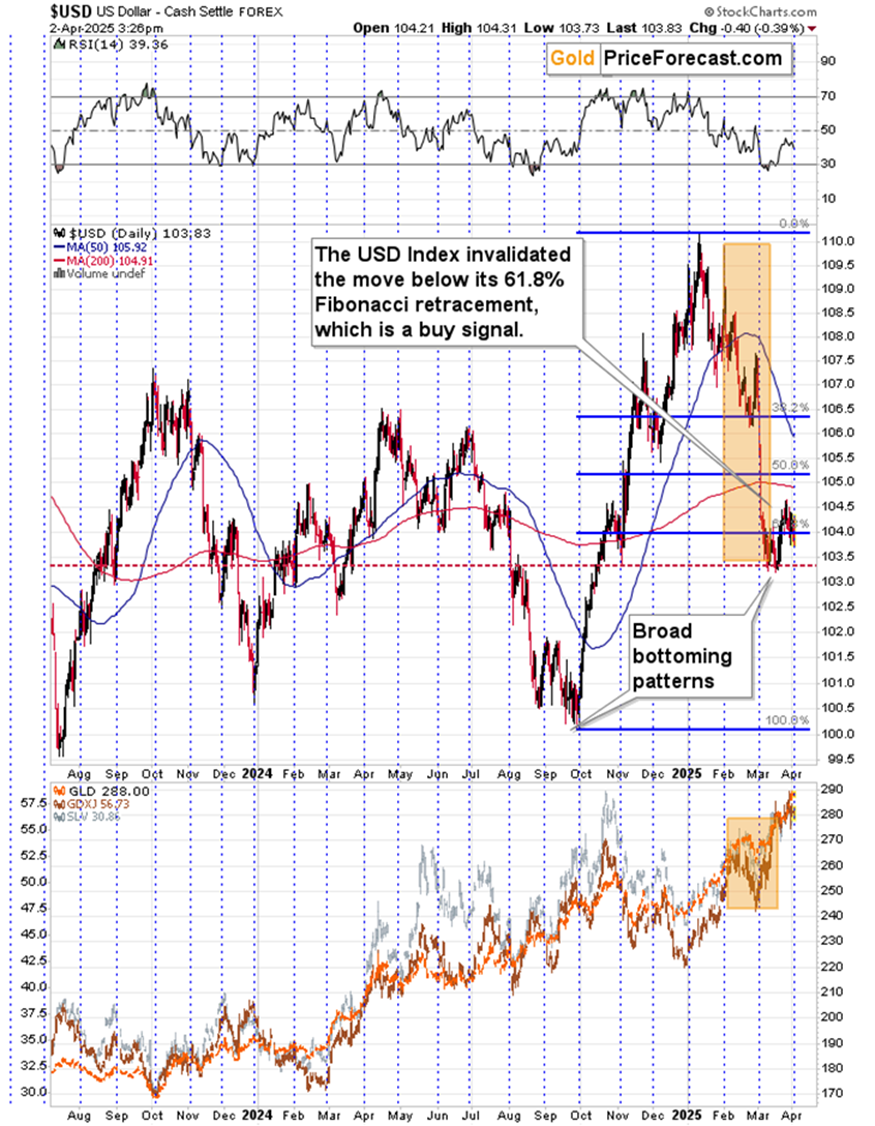
The USD Index is technically poised for a rally – it invalidated the move below its 61.8% Fibonacci retracement, and its monthly turning point is here (vertical, dashed lines). This perfectly aligns with the way in which the buy-the-rumor-sell-the-fact is likely to act in this case.
Let me emphasize something here: I expect the emotional decline to be reversed, not the fact that the USDX is likely to rally based on the tariffs.
As far as stocks are concerned, even though a decline in them makes perfect sense here, given the nature of the buy-the-rumor-sell-the-fact phenomenon, I wouldn’t be surprised by a short-term rally here.
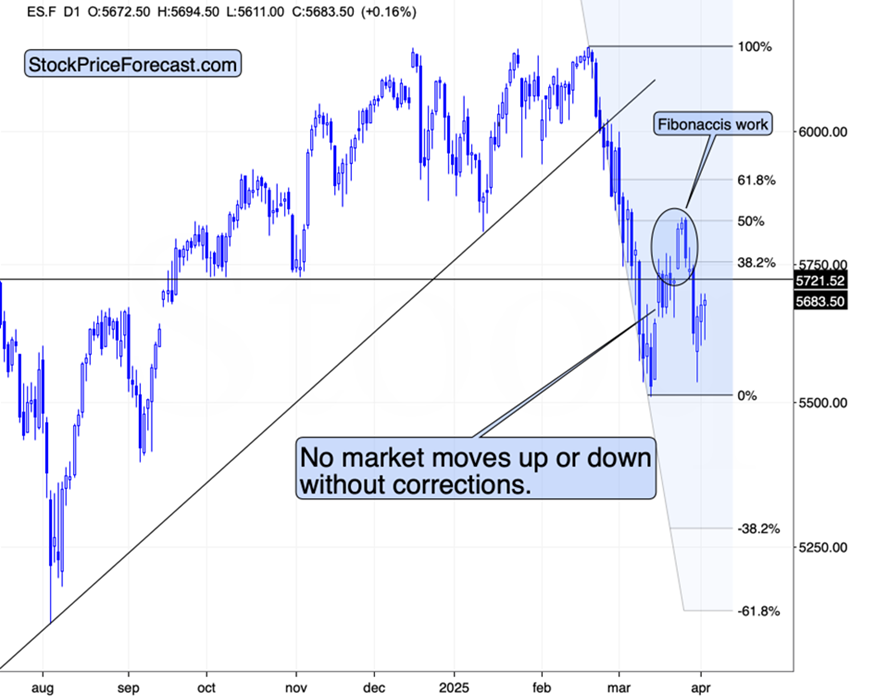
Yes, the S&P 500 Index already corrected to the 50% Fibonacci retracement in tune with what I said about it during my recent webinar, so it doesn’t have to move higher from the technical point of view before falling to new lows. However, seeing another move to this level or so would not be out of the question either.
Especially that Paul Rejczak’s just-released Volatility Breakout System flashed a buy signal yesterday. I don’t want to go into too many details here, as you’ll find them on the above-linked page (if you’re interested in trading stocks, I’d strongly suggest that you check it out, the trades in SPXL and SPXS would have resulted in profits of over 120% since March 12, 2024 vs. S&P’s 8.9% gain)
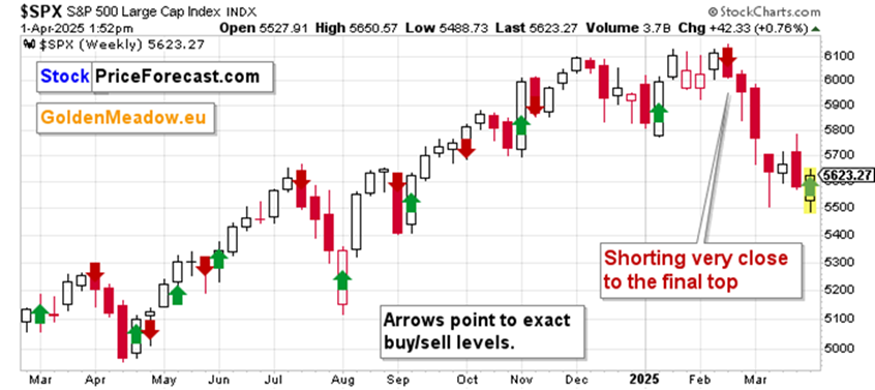
The above chart shows how frequent these signals are and how accurate they are. It’s all realistic, not fine-tuned or “optimized with the benefit of hindsight”. And yes, the system shorted stocks very close to their Feb. top. As you can see there were cases when the system switched the position on the week that followed the previous signal (in April and May 2024), so we might see something similar soon.
Either way, the above supports the scenario in which stocks rally based on the “fact” after having declined based on the “rumor”.
Would such a temporary rally in stocks be able to prevent declines in mining stocks? If gold/copper decline and the USD Index rallies (which are all likely), I don’t think so.
Want free follow-ups to the above article and details not available to 99%+ investors? Sign up to our free newsletter today!
Want free follow-ups to the above article and details not available to 99%+ investors? Sign up to our free newsletter today!
Author

Przemyslaw Radomski, CFA
Sunshine Profits
Przemyslaw Radomski, CFA (PR) is a precious metals investor and analyst who takes advantage of the emotionality on the markets, and invites you to do the same. His company, Sunshine Profits, publishes analytical software that any


