The imperative of daily analysis for informed trading

USD: Dec '23 is Up at 103.730.
Energies: Jan '24 Crude is Down at 72.97.
Financials: The Mar '24 30 Year T-Bond is Up 21 ticks and trading at 118.07.
Indices: The Dec '23 S&P 500 emini ES contract is 64 ticks Lower and trading at 4560.50
Gold: The Dec'23 Gold contract is trading Down at 2041.60.
Initial conclusion
This is not a correlated market. The USD is Up and Crude is Down which is normal, but the 30 Year T-Bond is trading Lower. The Financials should always correlate with the US dollar such that if the dollar is Higher, then the bonds should follow and vice-versa. The S&P is Lower and Crude is trading Lower which is not correlated. Gold is trading Lower which is correlated with the US dollar trading Up. I tend to believe that Gold has an inverse relationship with the US Dollar as when the US Dollar is down, Gold tends to rise in value and vice-versa. Think of it as a seesaw, when one is up the other should be down. I point this out to you to make you aware that when we don't have a correlated market, it means something is wrong. As traders you need to be aware of this and proceed with your eyes wide open. Asia is trading Lower with the exception of the Indian Sensex exchange. Europe is trading Higher with the exception of the London and the Milan exchanges which are Lower.
Possible challenges to traders
-
Final Services PMI out at 9:45 AM EST. This is Major.
-
ISM Services PMI is out at 10 AM EST. This is Major.
-
JOLTS Job Openings is out at 10 AM EST. This is Major.
-
RCM/TIPP Economic Optimism - tentative. This is Major.
Treasuries
Traders, please note that we've changed the Bond instrument from the 30 year (ZB) to the 10 year (ZN). They work exactly the same.
We've elected to switch gears a bit and show correlation between the 10-year bond (ZN) and the S&P futures contract. The S&P contract is the Standard and Poor's, and the purpose is to show reverse correlation between the two instruments. Remember it's likened to a seesaw, when up goes up the other should go down and vice versa. Today we aren't dealing with a correlated market and our bias is to the Upside.
Yesterday the ZN migrated Higher at around 9:30 AM EST as the S&P hit a High at around the same time. If you look at the charts below the S&P gave a signal at around 9:30 AM and the ZN started its Downward trend. Look at the charts below and you'll see a pattern for both assets. S&P hit a High at around 9:30 AM and migrated Lower. These charts represent the newest version of MultiCharts and I've changed the timeframe to a 15-minute chart to display better. This represented a Long opportunity on the 10-year note, as a trader you could have netted about 20 plus ticks per contract on this trade. Each tick is worth $15.625. Please note: the front month for the ZN is now Dec '23. The S&P contract is now Dec' 23. I've changed the format to filled Candlesticks (not hollow) such that it may be more apparent and visible.
Charts courtesy of MultiCharts built on an AMP platform
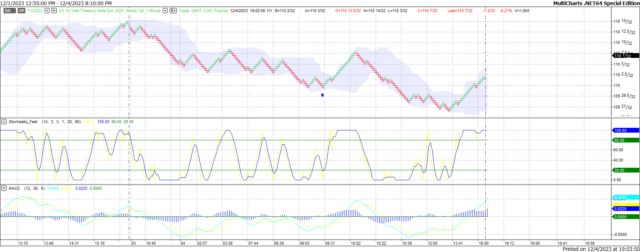
ZN - Dec 2023 - 12/04/23

S&P - Dec 2023 - 12/04/23
Bias
Yesterday we gave the markets a Neutral or Mixed bias as we didn't see much in the way of Market Correlation Monday morning. The markets veered to the Downside as the Dow dropped 41 points and the other indices lost ground as well. Today we aren't dealing with a correlated market and our bias is to the Downside.
Could this change? Of Course. Remember anything can happen in a volatile market.
Commentary
At times like this it's very easy to get caught up in the notion of one day up, next day down. After all it's easy and who doesn't like that. The problem is that the markets don't always follow that pattern. Which is why we do our due diligence and analyst the markets on a daily basis to ensure that you, the trader have the most up to date information that there is concerning market direction. But we do our homework on a daily basis. Why? Because the markets change each and every day; so we can't and don't assume anything. Today we have more economic news than we had yesterday so time will tell how it all works out.
Author

Nick Mastrandrea
Market Tea Leaves


