The Fed will commence interest rate reductions in 2024

USD: Mar '24 is Up at 101.135.
Energies: Feb '24 Crude is Down at 70.97.
Financials: The Mar '24 30 Year T-Bond is Up 3 ticks and trading at 121.05.
Indices: The Dec '23 S&P 500 emini ES contract is 68 ticks Lower and trading at 4781.50.
Gold: The Feb'24 Gold contract is trading Up at 2030.60.
Initial conclusion
This is not a correlated market. The USD is Up and Crude is Down which is normal, and the 30 Year T-Bond is trading Higher. The Financials should always correlate with the US dollar such that if the dollar is Higher, then the bonds should follow and vice-versa. The S&P is Lower and Crude is trading Lower which is not correlated. Gold is trading Higher which is not correlated with the US dollar trading Up. I tend to believe that Gold has an inverse relationship with the US Dollar as when the US Dollar is down, Gold tends to rise in value and vice-versa. Think of it as a seesaw, when one is up the other should be down. I point this out to you to make you aware that when we don't have a correlated market, it means something is wrong. As traders you need to be aware of this and proceed with your eyes wide open. All of Asia is trading Lower. Currently all of Europe is trading Lower as well.
Possible challenges to traders
-
Retail Sales s out at 8:30 AM EST. This is Major.
-
Core Retail Sales is out at 8:30 AM EST. This is Major.
-
Import Prices m/m is out at 8:30 AM EST. This is Major.
-
FOMC Member Barr Speaks at 9 AM EST. This is Major.
-
FOMC Member Bowman Speaks at 9 AM EST. This is Major.
-
Industrial Production m/m is out at 9:15 AM EST. This is Major.
-
Capacity Utilization Rate is out at 9:15 AM EST. This is Major.
-
Business Inventories m/m is out at 10 AM EST. This is Major.
-
NAHB Housing Market Index is out at 10 AM EST. This is Major.
-
Beige Book is out at 2 PM EST. This is Major.
-
FOMC Member Williams Speaks at 3 PM EST. This is Major.
Treasuries
Traders, please note that we've changed the Bond instrument from the 30 year (ZB) to the 10 year (ZN). They work exactly the same.
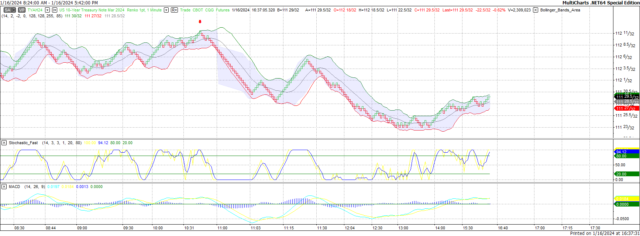
We've elected to switch gears a bit and show correlation between the 10-year bond (ZN) and the S&P futures contract. The S&P contract is the Standard and Poor's, and the purpose is to show reverse correlation between the two instruments. Remember it's likened to a seesaw, when up goes up the other should go down and vice versa.
Yesterday the ZN migrated Lower at around 10:40 AM EST as the S&P hit a Low at around the same time. If you look at the charts below the S&P gave a signal at around 10:40 AM and the ZN started its Downward trend. Look at the charts below and you'll see a pattern for both assets. S&P hit a Low at around 10:40 AM and migrated Higher. These charts represent the newest version of MultiCharts and I've changed the timeframe to a 15-minute chart to display better. This represented a Short opportunity on the 10-year note, as a trader you could have netted about 20 plus ticks per contract on this trade. Each tick is worth $15.625. Please note: the front month for the ZN is now Mar '24. The S&P contract is now Mar' 24. I've changed the format to filled Candlesticks (not hollow) such that it may be more apparent and visible.
Charts courtesy of MultiCharts built on an AMP platform
ZN - Mar 2024 - 01/12/24
-638410954220578199.png)
S&P - Mar 2024 - 01/16/24
Bias
As per our last edition we gave the markets a Downside bias. The markets didn't disappoint as the Dow dropped 232 points and the other indices lost ground as well. Today we aren't dealing with a correlated market and our bias is to the Downside.
Could this change? Of Course. Remember anything can happen in a volatile market.
Commentary
Yesterday was the first day back after the MLK holiday and usually we see a spike up after a holiday. That didn't happen yesterday as FOMC Member Christopher Waller mad the remark that the Fed wasn't in any hurry to reduce interest rates. That's all it took to drive the markets down by hundreds of points. This is why each and every time an FOMC Member speaks we always tag that as major because you never know what they're going to say and how the markets will react to what they say. Everyone is enthused with the idea that the Fed will commence interest rate reductions in 2024. Anything contrary to that will be met with a falloff such as we witnessed yesterday. Today we have a virtual tsunami in terms of economic reports. We have 10 scheduled for today, all of which are major. Could these reports propel the markets higher? As in all things, only time will tell.
Author

Nick Mastrandrea
Market Tea Leaves


