The difference between a setup, signal and trigger – Technical analysis: NOK/USD, US 30, Ethereum

Ever spotted a great setup… only to enter too early or too late? You might be confusing the setup with the signal and the trigger.
Setups, signals, triggers - these words get used interchangeably - and that’s fine - they are just words. What’s important is you having your own well defined process whereby your idea for a trade translates to a timely execution with good risk: reward.
Weekly thoughts
Here’s how I think about it
Hierarchy: Setup → Signal → Trigger
Let’s break it down:
Setup = The conditions you're looking for.
The setup is the general market condition or structure that you're interested in trading. It's the broader context that tells you where to look, not necessarily when to act.
For me these are based on trend direction and market structure. Others might use volatility etc
Examples:
-
Price is in an uptrend and pulling back to a support zone.
-
Consolidating near all-time highs (possible breakout candidate).
Signal = An alert that something is about to happen.
A signal is a more specific indication that a trade is ready to be taken. It's like an alarm that says: “Your setup is shaping up.”
If we use the same setup as above, the ‘signal stage’ would be as follows:
Examples:
-
Price has pulled back and hit a support level.
-
A breakout above a key resistance level has happened.
Trigger = Entry confirmation.
A trigger is the specific condition that tells you to execute the trade. It’s often more precise and related to price action, volume, or timing.
The trigger is what gives you confidence to “pull the trigger”.
Again, using what was a setup, then a signal; the trigger could look like this–
Examples:
-
A reversal candlestick pattern completes at the support level.
-
A retest and hold of the resistance level which has now become support.
Here’s a flow chart to summarise the idea:
Regular readers will know that I employ multiple timeframe analysis.
So the way I generally see things is - the weekly chart gives me setup and my signal - and the daily chart gives me my trigger. If you’re a day trader, you might use the daily chart and 1 hour chart in the same way.
Of course I have an example to show you guys - the Norwegian krone
I want to trade the signal from the weekly chart but I need to wait for the right trigger on the daily chart.
Weekly setups and signals
We look at hundreds of charts each week and present you with three of our favourite setups and signals. For more setups, please get in touch with us.
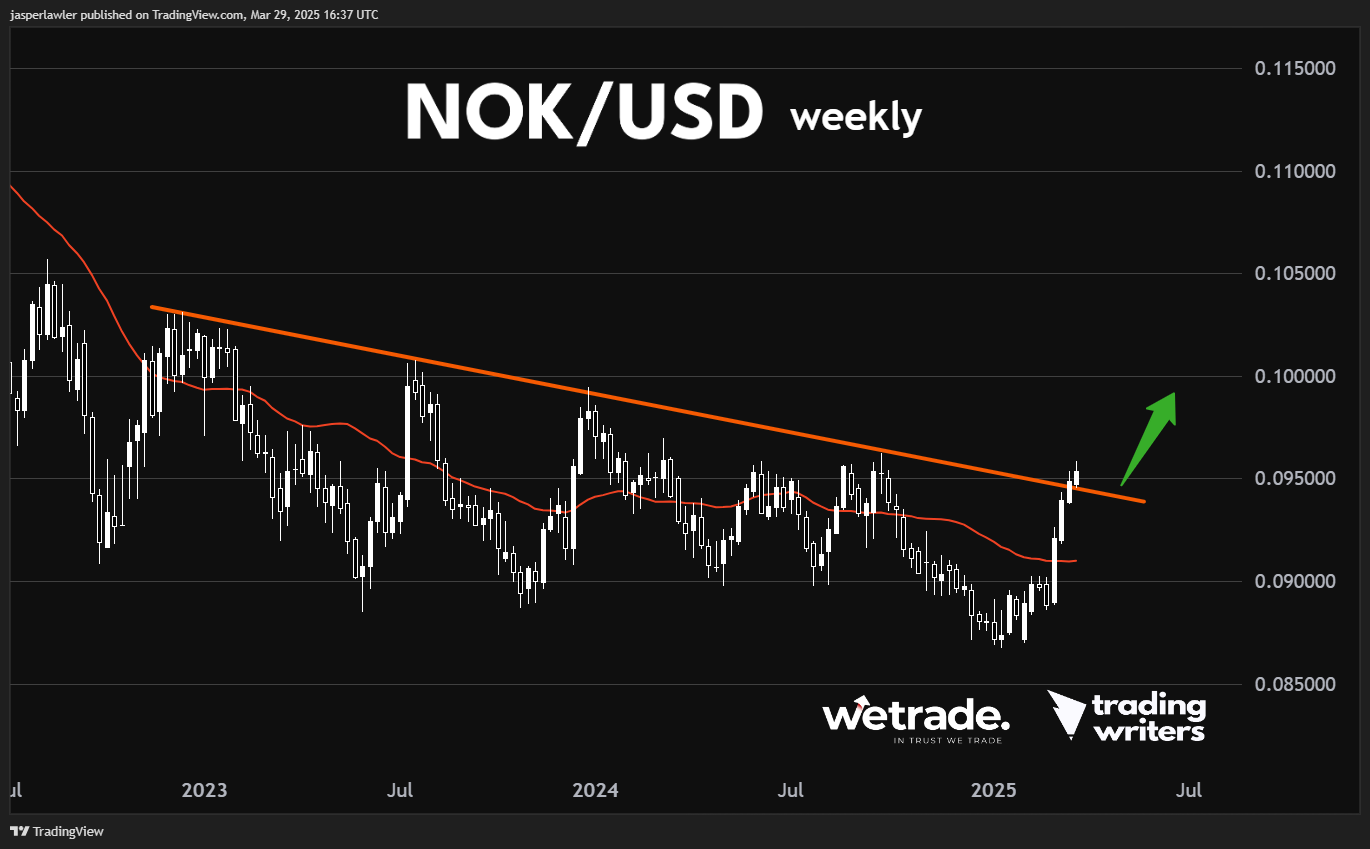
NOK/USD
Long term chart (weekly)
Trend: Down.
Phase: Possible reversal.
Resistance = 0.10.
Support = 0.088.
Price action:
The Nokie has been trading in a slow meandering downtrend for 2 years, coming off the back of a sharper downtrend from 2021-22. The weekly chart is showing the breakout above a downtrend linen signalling a possible trend reversal.
View: Bullish while the price is above the broken downtrend line.
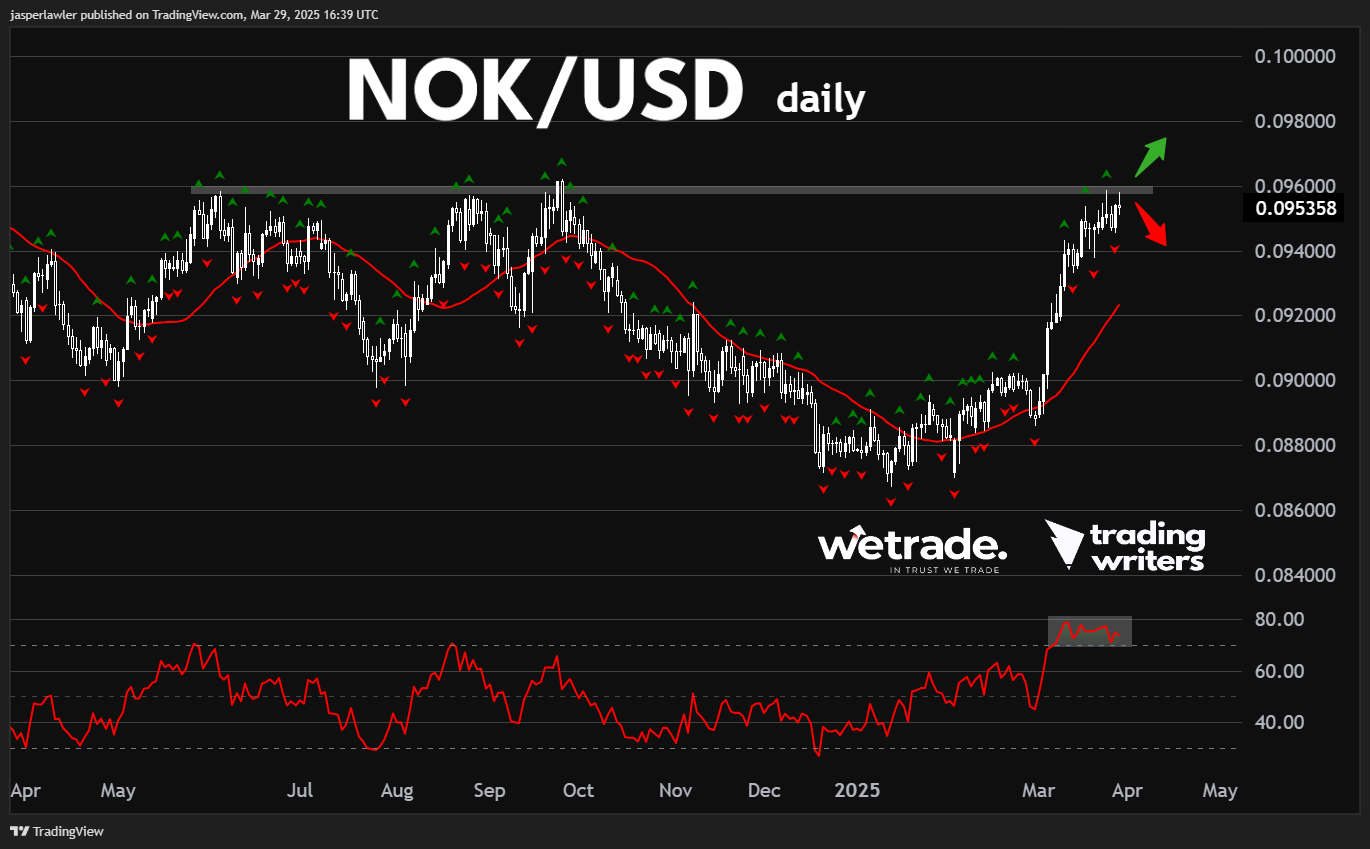
Medium term chart (daily)
Trend: Up.
Phase: impulsive.
Resistance = 0.096.
Support = 0.092.
Price action: The daily chart shows price heavily overbought and under a well-established resistance level. We would like to see a daily close above this resistance as the trigger to take advantage of the weekly signal.
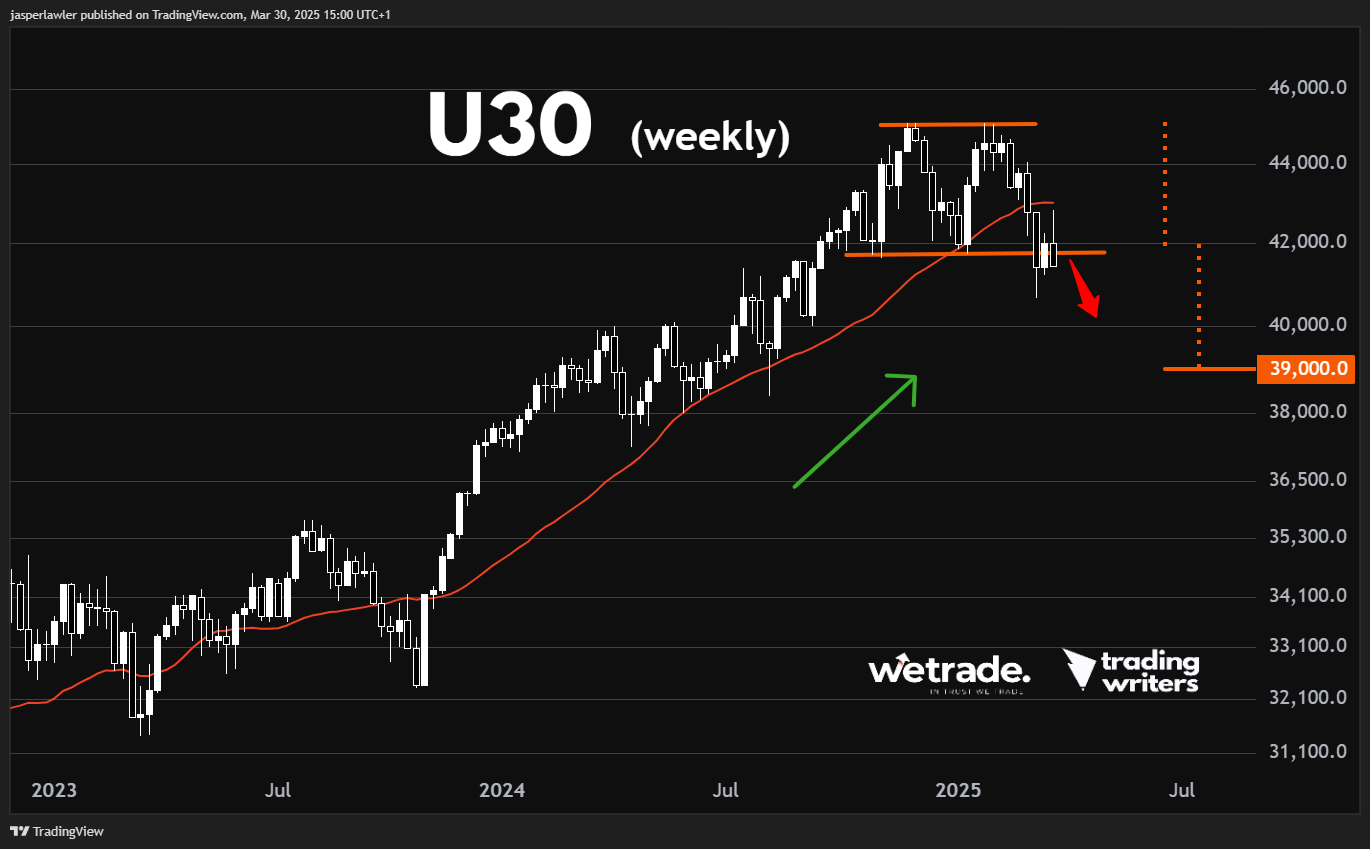
US 30
Long term chart (weekly).
Trend: Up.
Phase: Completed top pattern.
Resistance = 45,000.
Support = 39,000.
Price action: After a false breakdown the week prior, the price has again closed back under the critical 42,000 level and neckline to the double top pattern. A measure move using the height of the double top would target 39,000.
View: Bearish while below 42,000.
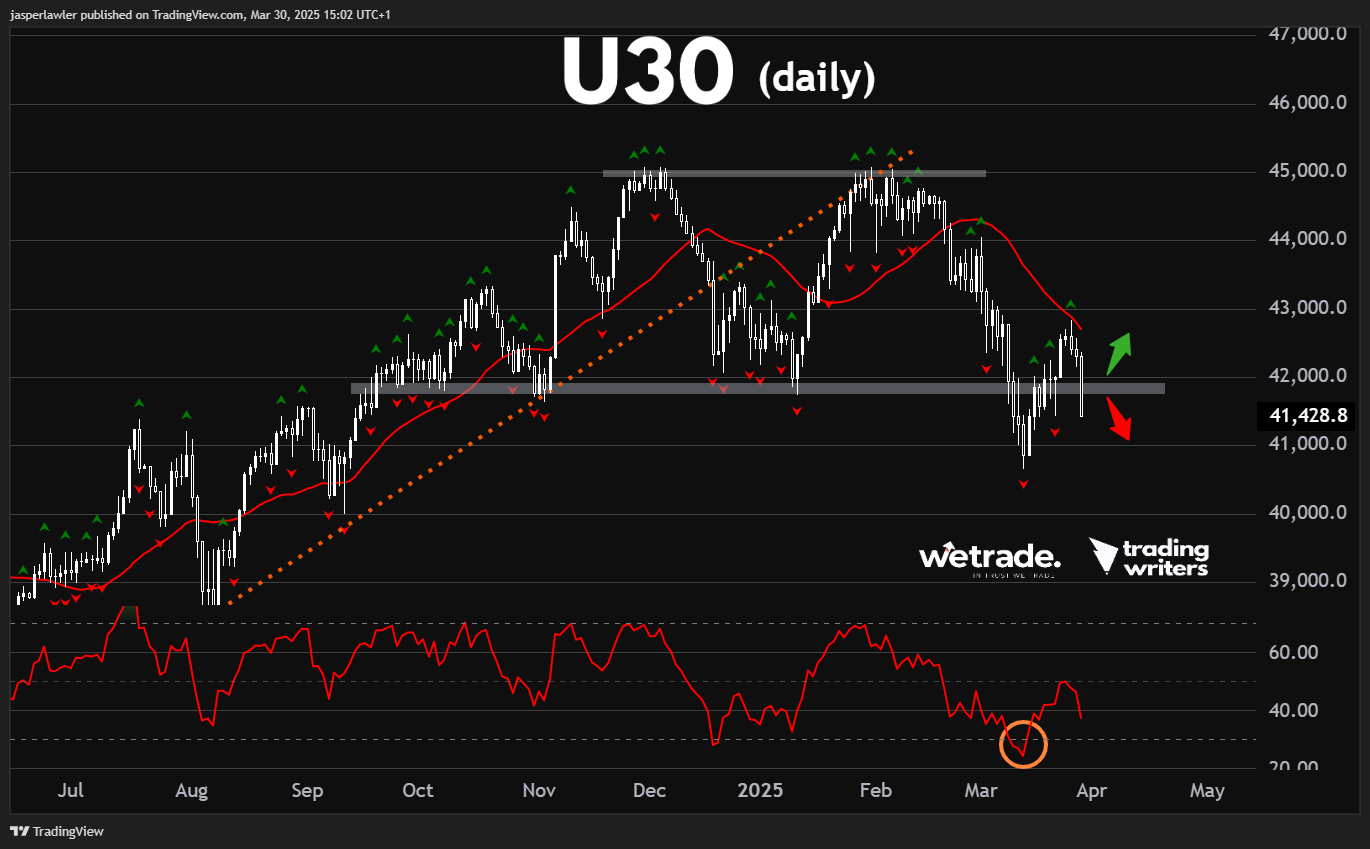
Medium term chart (daily)
Trend: Down.
Phase: pullback.
Resistance = 43,000.
Support = 41,000.
Price action: Price is rolling over again after a rebound from the initial big drop from the 45,000 and into oversold conditions on the RSI. Importantly price failed to hold back above key support at 42,000 indicating a bearish continuation move to new lows.
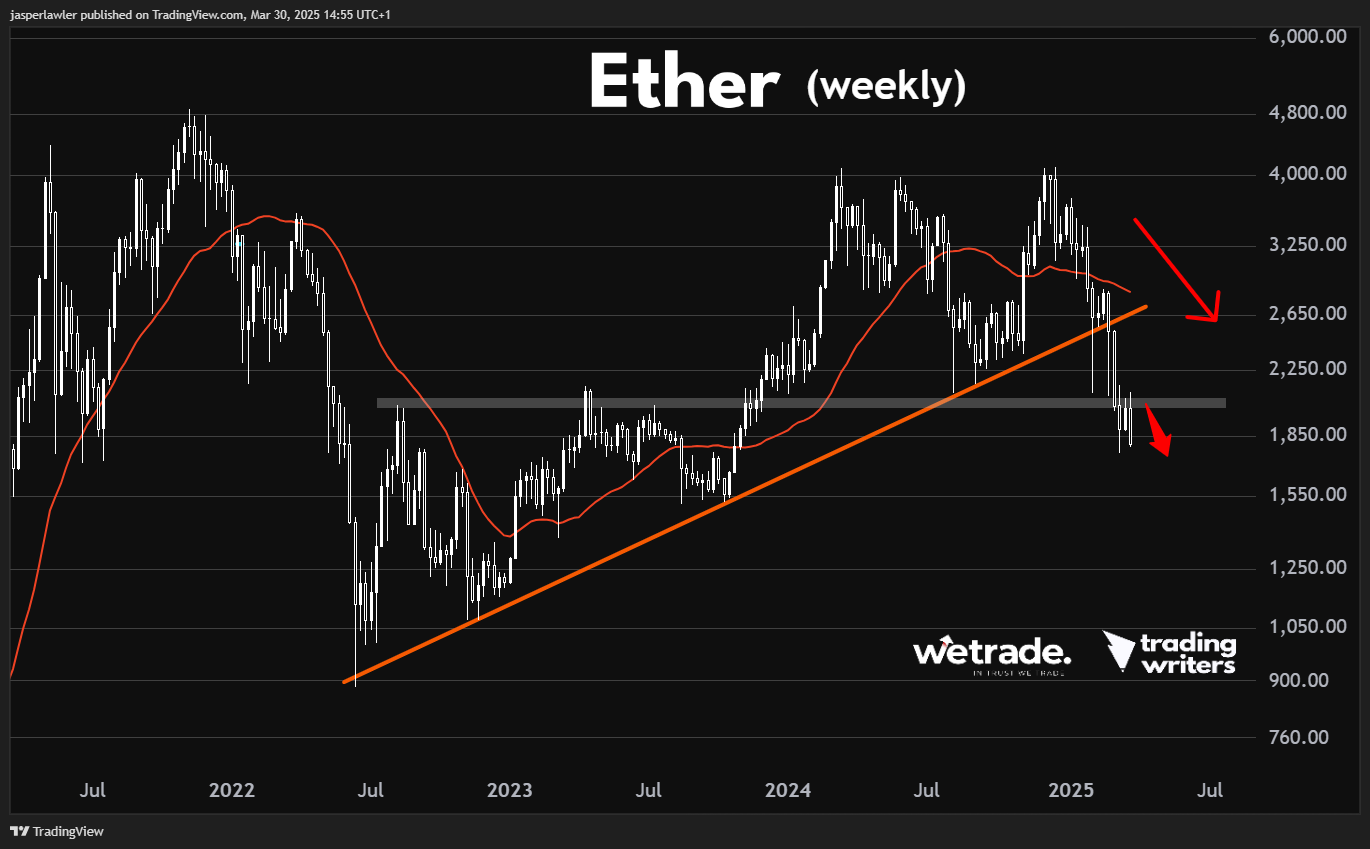
Ethereum (ETH/USD)
Long term chart (weekly)
Trend: Down.
Phase: New impulse lower.
Resistance = 2650.
Support = 1000.
Price action: The price has continued its descent after breaking the rising trendline and has now taken out critical support at 2,000.
View: Bearish while below the broken trendline.
Medium term chart (daily)
Trend: Down.
Phase: Continuation.
Resistance = 2500.
Support = 1800.
Price action: The price continues to hug its 30-day moving average in a long downtrend. The tight consolidation around 2000 has just seen a breakdown indicating new lows this week.
But - as always - that’s just how the team and I are seeing things, what do you think?
In collaboration with WeTradeBroker
Author

Jasper Lawler
Trading Writers
With 18 years of trading experience, Jasper began his career as a stockbroker on Wall Street in New York City before sharpening his analytical skills at top trading firms in the City of London.


