Oil is probably bull trapping
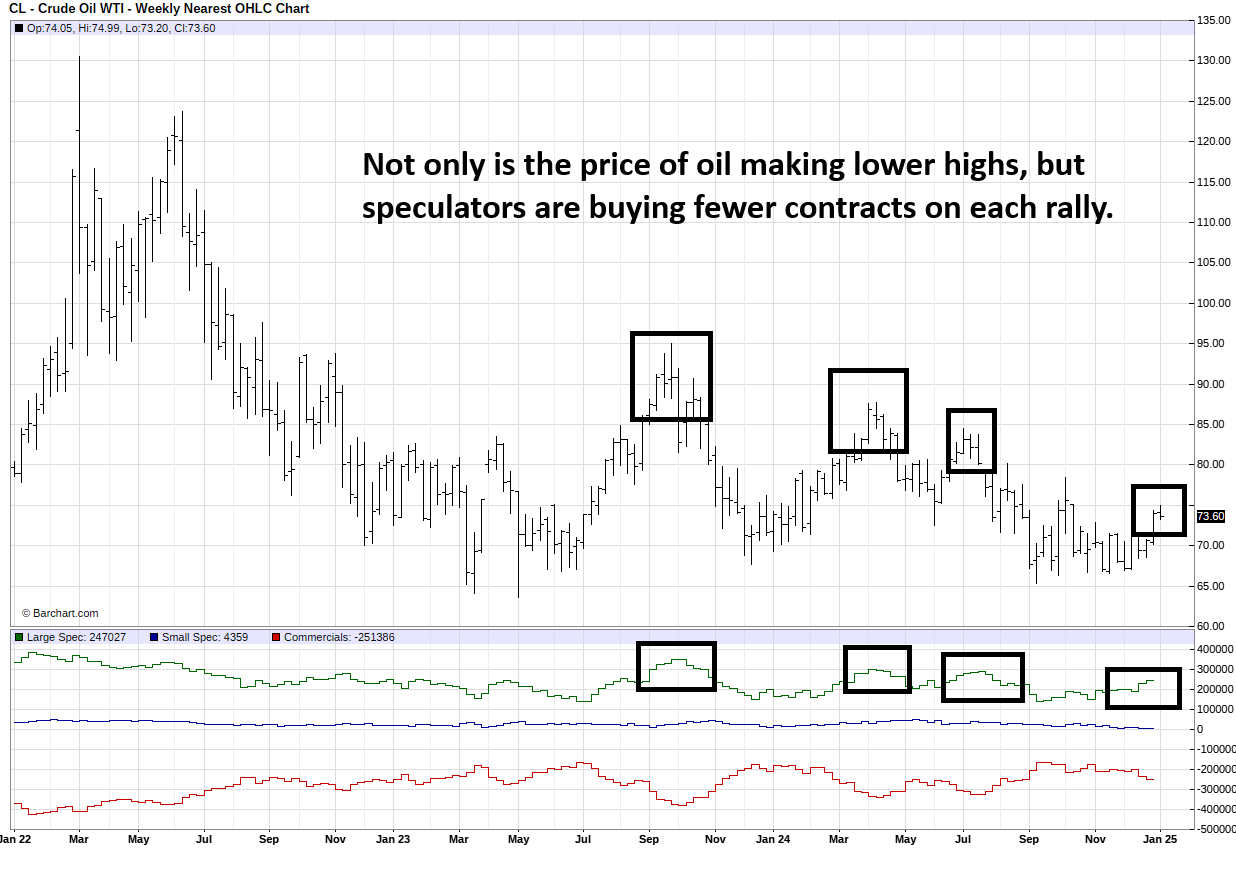
Crude oil rallies have made lower highs since March 2022; we are probably bull trapping.
Crude oil rallies have a way of garnering bullish enthusiasm despite years of consistently lower highs. Since peaking in March 2022, the oil market has attempted multiple rallies backed by compelling storylines, yet each has been a false flag. Until this pattern breaks, we have to assume it will continue. Accordingly, the current oil up move is likely better traded from the short side than the long side.
Oil fundamentals are neutral to bearish
From a fundamental stance, a lofty US dollar, high interest rates, lackluster Chinese demand, and bearish seasonality should work against the oil rally. Further, although the US economy has thrived, other developed nations are more concerned about deflation than inflation. This doesn’t bode well for the demand side of the equation in the long run.
On the supply side, OPEC has been doing the heavy lifting to stabilize prices. US oil production is at or near all-time highs, compelling the cartel to extend production cuts much longer than originally anticipated. The majority of failed oil rallies in recent years have been triggered by concern over supply disruptions caused by Middle East Violence, but not one of those instances has resulted in a meaningful change to the global oil balance sheet. We might find that speculators who have been burned chasing prices higher for years will remain sidelined or play the other side of the market.
It cannot be ignored that the administration coming into office later this month has a “drill, baby, drill” mentality. Still, there appear to be some attempts at thwarting that agenda by the departing administration, which has established an executive order to ban new offshore drilling in certain parts of the country. Nevertheless, the oil and gas industry has already shown signs of adjusting its mindset for a more business-friendly environment. We believe this will encourage additional supply where possible. On the flip side, the Trump administration has hinted they will be tightening the rope on Iran and Russian sanctions, which has the potential to take barrels of oil off the global market. Do you see how difficult trading on fundamentals can be? For this reason, we pay closer attention to market positioning, seasonality, and chart analysis.
Speculators are less bullish on each failed rally
The COT Report (Commitments of Traders) issued by the CFTC (Commodity Futures Trading Commission)tells us that large speculators are currently moderately long the oil market to the tune of 250,000 futures contracts. This in itself isn’t noticeable, but when you compare previous oil rallies, it is clear that speculators are progressively less willing to amass a bullish position in oil. The last rally peaked with speculators holding about 275,000 contracts; if the pattern of less aggressive buying continues, the buying is likely to dry up soon, if it hasn’t already.
The charts are decisively bearish
Technical analysts will tell you that the oil market has recently poked above the 200-day moving average for the seventh time since July. The bulls spent last week embracing the breakout, but the previous six occasions were bull traps, which made those who chased momentum higher suffer the consequences of their lack of patience. Further, this particular move above the 200-day moving average occurred in light holiday trade, which is prone to unsustainable price spikes caused by algorithms and stops loss running. In other words, holiday markets and holiday breakouts cannot be trusted.
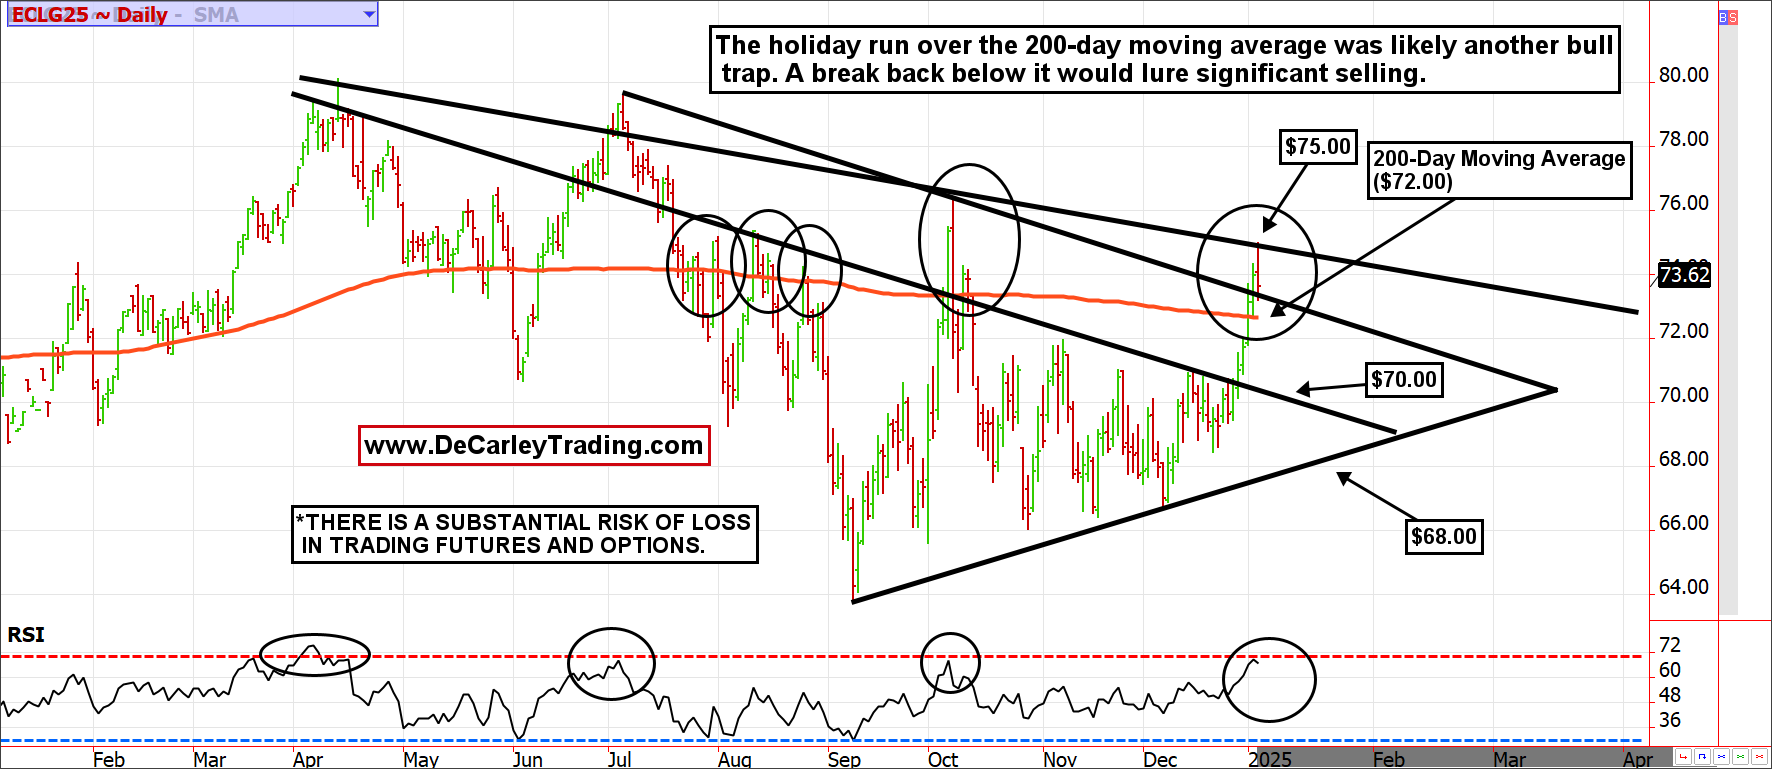
The daily oil chart shows that the RSI (Relative Strength Index) is slightly extended. This suggests that a break below the 200-day moving average of nearly $72.00 would lead toward liquidation selling. The market would likely find support near $70.00 and again at $68.00, but a break of $68.00 could be unforgiving to the bulls.
The weekly chart also depicts a market trying to break out, but one in which failure could be catastrophic. If prices can’t break and hold above $75.00 sooner rather than later, gravity will bring prices back into the $65.00 price range. However, we have been following oil long enough to know support is never absolute, and the more trade knocks on the cellar door, the more likely it is to open. We suspect a break below daily support at $68.00 would increase the odds of the weekly chart support line of $65.00 failing. If so, we would likely see a precipitous decline to the low-$50.00s.

Conclusion
The oil market has been eerily quiet—so quiet that we might be in store for a historical rug pull. The jury is still out on the rally, but the stars are aligning for a bull trap. The latest rally occurred while most of us ate ham and turkey with our families. Still, as liquidity returns to the markets in post-holiday trade, we have to believe the sellers will return to the oil markets just as they have in each of the rallies since early 2022.
Author

Carley Garner
DeCarley Trading
Carley Garner is an experienced commodity broker with DeCarley Trading, a division of Zaner, in Las Vegas, Nevada. She is also the author of multiple books including, “Higher Probability Commodity Trading” and “A Trader's First Book on Commodities”.


