The oil benchmarks came under pressure opening the new on downside gaps, after the beginning of implying the Iranian nuclear deal which should flood oversupplied market by another 0.5m barrels daily initially, before increasing by 1m barrels a day within 6 months, as the Iranian National Oil Co. has said.
The deal hurts the income of the other gulf rivals because this new pumped ample of oil to the market comes from the same region, as a real competitor to the productions of these nations which have been actually suffering from the Iranian interventions into the middle east Arabian regions.
The deal dampened Iran gulf rivals equities markets, as the lower oil prices form increasing pressure on their capital spending and also consuming spending causing harder financial conditions.
While the Chinese equities indexes are still undermining the risk appetite by their meltdown which resumed in the beginning of the new week, despite the recent taken action by PBOC to impose reserve ratio on offshore Yuan accounts to lower the speculations against the Chinese currency which has been hurt by increasing expectations of having lower interest rate to support the Chinese economy which is looking now for soft landing of its expansion pace by showing tomorrow growth by 6.8% y/y in the fourth quarter of last year, after growth by 6.9% in the third quarter.
While the risks around the US economy are still looming with lower manufacturing performance, after Jan NY Empire State Manufacturing Index has shown falling to -19.37, while the consensus was referring to improving to -4 from -6.21 in December.
From another side, Dec US retails sales came also to weigh down on the US last session showing decreasing in December by 0.1%, while the market was waiting for no monthly change, after rising by 0.4% in November.
Instrument in Focus: USDJPY
The risk aversion sentiment could boost demand for the Japanese yen, as this low cost financing currency usually gains benefits during the dovish market sentiment.
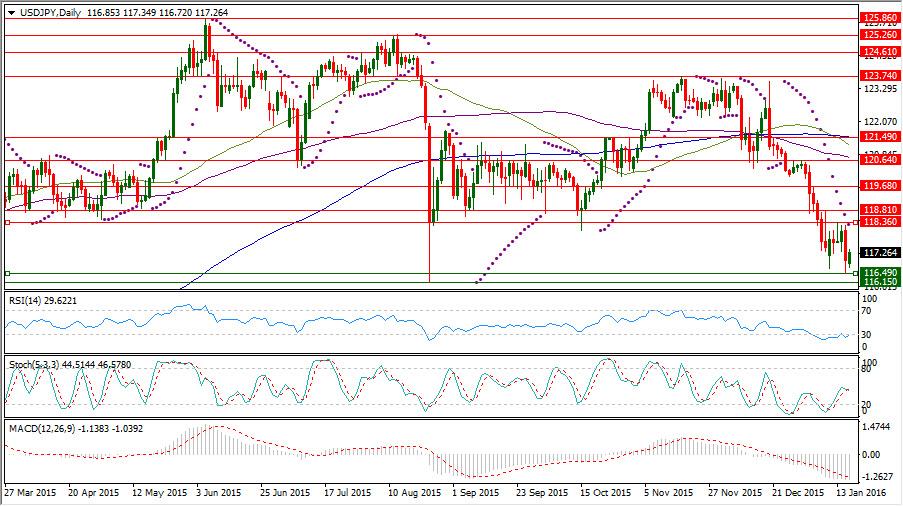
USDJPY has been exposed to increasing downside momentum by the end of last week to fall to 116.49 containing its full rebound from 116.67 which ended to having another lower high at 118.36.
The Japanese yen gains benefits from the Chinese Yuan suffering, as an Asian competitive reserve currency, while there is no signal yet from BOJ to take further easing steps.
So, USDJPY could rebound for trading now near 117.20 in the beginning of the new week following PBOC step to impose reserve ratio on offshore Yuan accounts.
USDJPY daily RSI is referring now to existence barely in its oversold area below 30 reading now 29.622, while its daily Stochastic Oscillator (5, 3, 3) which is more sensitive to the volatility could have its main line in the neutral region coming up from its oversold area below 20 reading now 44.514 and also its signal line is reading now 46.578.
USDJPY daily Parabolic SAR (step 0.02, maximum 0.2) is reading 118.27 in its day number 17 of consecutive being above the trading rate reflecting accumulating of the downside pressure on this pair.
new week following PBOC step to impose reserve ratio on offshore Yuan accounts. USDJPY daily RSI is referring now to existence barely in its oversold area below 30 reading now 29.622, while its daily Stochastic Oscillator (5, 3, 3) which is more sensitive to the volatility could have its main line in the neutral region coming up from its oversold area below 20 reading now 44.514 and also its signal line is reading now 46.578. USDJPY daily Parabolic SAR (step 0.02, maximum 0.2) is reading 118.27 in its day number 17 of consecutive being above the trading rate reflecting accumulating of the downside pressure on this pair.
Important levels: Daily SMA50 @ 121.19, Daily SMA100 @ 120.73 and Daily SMA200 @ 121.50
S&R:
S1: 116.49
S2: 116.15
S3: 115.55
R1: 118.49
R2: 118.81
R3: 119.68
USDJPY Daily Chart:
Commodities: CL FEB 16
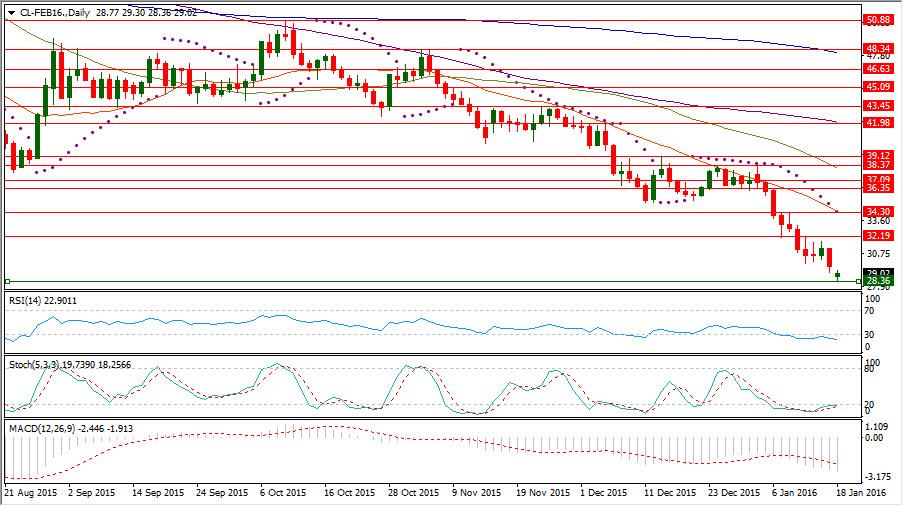
CL FEB 16 has fallen in the beginning of the new week to $28.36 per barrel, after failing to sustain any more above $30 level by the end of last week causing more stop buying orders triggering opening new range of trading below this psychological level.
After rebounding for trading near $29, CL FEB 16 daily RSI is still referring to existence in its oversold area below 30 reading now 22.901 and also its daily Stochastic Oscillator (5, 3, 3) which is more sensitive to the volatility is having its main line in the oversold region below 20 reading now 19.739 with its signal line which is referring to this same area reading 18.259.
After implying the Iranian Nuclear deal, CL FEB 16 is now trading between the selling panic force and the need for correction to the upside at least for the principle of "buying on rumors selling on fact".
Important levels: Daily SMA20 @ $34.35, Daily SMA50 @ $38.10, Daily SMA100 @ $42.07 and Daily SMA200 @ $48.11.
S&R:
S1: $28.36
S2: $26.71
S3: $25.04
R1: $32.19
R2: $34.30
R3: $36.35
CL FEB 16 Daily chart:
Hot instrument: SP-MAR16
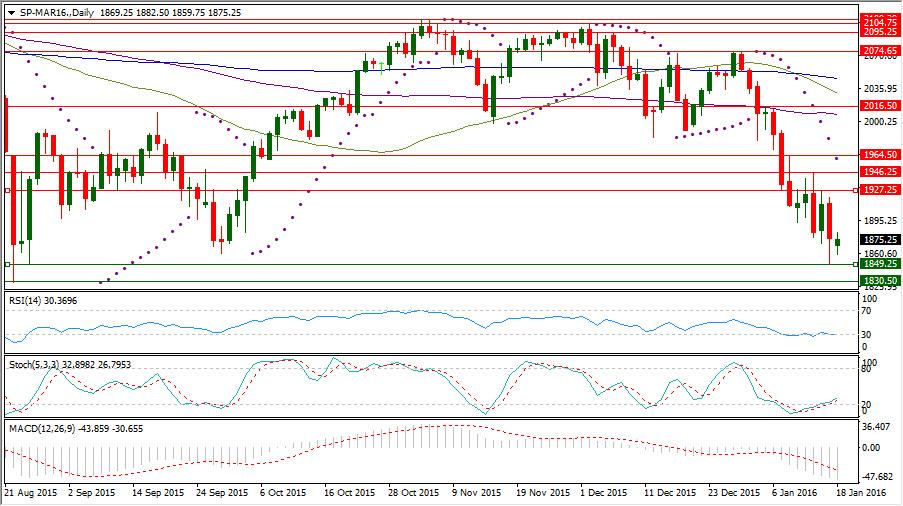
SP-MAR16 rose for trading near 1875, after being exposed to downside extension to 1849.25 following forming another lower high at 1927.25 below 1946.25 which has been its highest level last week, after Dec US labor report bullish release led merely to a spike to 1964.50, before retreating again.
SP-Mar16 daily RSI is referring now to existence barely in the neutral area coming from its oversold area below 30 reading 30.369 and also its daily Stochastic Oscillator (5, 3, 3) which is more sensitive to the volatility is having now its main line in the neutral area reading 32.898 leading its signal line to come out too from the oversold region below 20 reading now 27.795.
Important levels: Daily SMA50 @ 2030.48, Daily SMA100 @ 2008.22 and Daily SMA200 @ 2046.91
S&R:
S1: 1849.25
S2: 1830.50
S3: 1812.38
R1: 1964.50
R2: 1927.25
R3: 1964.50
SP-MAR16 Daily chart:
Recommended Content
Editors’ Picks

AUD/USD: The hunt for the 0.7000 hurdle
AUD/USD quickly left behind Wednesday’s strong pullback and rose markedly past the 0.6900 barrier on Thursday, boosted by news of fresh stimulus in China as well as renewed weakness in the US Dollar.

EUR/USD refocuses its attention to 1.1200 and above
Rising appetite for the risk-associated assets, the offered stance in the Greenback and Chinese stimulus all contributed to the resurgence of the upside momentum in EUR/USD, which managed to retest the 1.1190 zone on Thursday.

Gold holding at higher ground at around $2,670
Gold breaks to new high of $2,673 on Thursday. Falling interest rates globally, intensifying geopolitical conflicts and heightened Fed easing bets are the main factors.

Bitcoin displays bullish signals amid supportive macroeconomic developments and growing institutional demand
Bitcoin (BTC) trades slightly up, around $64,000 on Thursday, following a rejection from the upper consolidation level of $64,700 the previous day. BTC’s price has been consolidating between $62,000 and $64,700 for the past week.

RBA widely expected to keep key interest rate unchanged amid persisting price pressures
The Reserve Bank of Australia is likely to continue bucking the trend adopted by major central banks of the dovish policy pivot, opting to maintain the policy for the seventh consecutive meeting on Tuesday.

Five best Forex brokers in 2024
VERIFIED Choosing the best Forex broker in 2024 requires careful consideration of certain essential factors. With the wide array of options available, it is crucial to find a broker that aligns with your trading style, experience level, and financial goals.


