The bulls stampede

US Dollar: Jun '23 USD is Up at 102.280.
Energies: May '23 Crude is Up at 79.91.
Financials: The Jun '23 30 Year T-Bond is Down 19 ticks and trading at 130.18.
Indices: The Jun '23 S&P 500 Emini ES contract is 18 ticks Lower and trading at 4133.25.
Gold: The Apr'23 Gold contract is trading Down at 1981.00. Gold is 52 ticks Lower than its close.
Initial conclusion
This is not a correlated market. The USD is Up, and Crude is Up which is not normal, and the 30 Year T-Bond is trading Lower. The Financials should always correlate with the US dollar such that if the dollar is Higher, then the bonds should follow and vice-versa. The S&P is Lower, and Crude is trading Higher which is correlated. Gold is trading Lower which is correlated with the US dollar trading Up. I tend to believe that Gold has an inverse relationship with the US Dollar as when the US Dollar is down, Gold tends to rise in value and vice-versa. Think of it as a seesaw, when one is up the other should be down. I point this out to you to make you aware that when we don't have a correlated market, it means something is wrong. As traders you need to be aware of this and proceed with your eyes wide open. At the present time all of Asia is trading Higher. Currently Europe is trading Mixed with the German Dax and teh Spanish Ibex exchanges Lower. .
Possible challenges to traders today
-
Final Manufacturing PMI is out at 9:45 AM EST. This is Major.
-
ISM Manufacturing PMI is out at 10 AM EST. This is Major.
-
ISM Manufacturing Prices is out at 10 AM EST. This is Major.
-
Construction Spending m/m is out at 10 AM EST. This is Major.
-
Wards Total Vehicle Sales is out All Day - By Brand. This is Major.
Treasuries
Traders, please note that we've changed the Bond instrument from the 30 year (ZB) to the 10 year (ZN). They work exactly the same.
We've elected to switch gears a bit and show correlation between the 10-year bond (ZN) and the S&P futures contract. The S&P contract is the Standard and Poor's, and the purpose is to show reverse correlation between the two instruments. Remember it's likened to a seesaw, when up goes up the other should go down and vice versa.
On Friday the ZN hit a High at around 8:30 AM EST but at the same time the S&P hit a Low. If you look at the charts below the ZN gave a signal at around 8:30 AM and the ZN continued its Downward trend. Look at the charts below and you'll see a pattern for both assets. S&P hit a Low at around 8:30 AM and migrated Higher. These charts represent the newest version of MultiCharts and I've changed the timeframe to a 15-minute chart to display better. This represented a Short opportunity on the 10-year note, as a trader you could have netted about 20 ticks per contract on this trade. Each tick is worth $15.625. Please note: the front month for the ZN is now Jun '23. The S&P contract is also Jun' 23. I've changed the format to filled Candlesticks (not hollow) such that it may be more apparent and visible.
Charts courtesy of MultiCharts built on an AMP platform
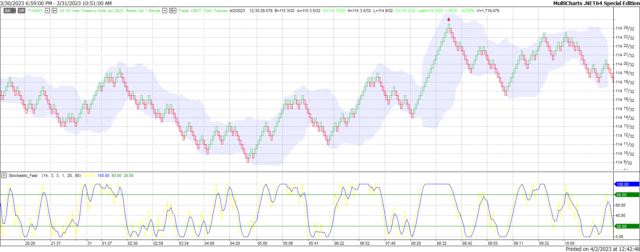
ZN - Jun 2023 - 3/31/23
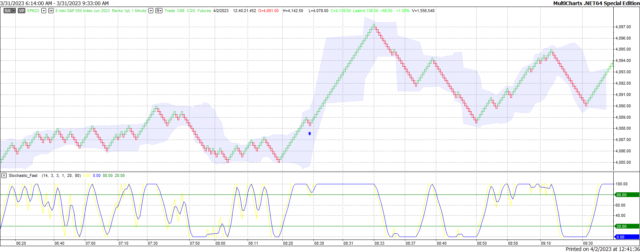
S&P - Jun 2023 - 3/31/23
Bias
On Friday we gave the markets an Upside bias. Both Gold and the Bonds were trading Lower and that usually reflects an Upside Day. The markets didn't disappoint as the Dow traded Higher by 415 points and the other indices traded Higher as well. Today we aren't dealing with a correlated market and our bias is Neutral or Mixed.
Could this change? Of Course. Remember anything can happen in a volatile market.
Commentary
On Friday we gave the markets an Upside bias as Gold and Bonds were both trading Lower and this usually reflects an Upside Day. The markets didn't disappoint as the Dow traded 415 points Higher and the other indices traded Higher as well. Today we have ISM numbers, Construction Spending and Total Vehicle Sales all of which are Major so perhaps the upward trend will continue.
Author

Nick Mastrandrea
Market Tea Leaves


