The bulls roar finally [Video]
![The bulls roar finally [Video]](https://editorial.fxstreet.com/images/TechnicalAnalysis/Positioning/wall-street-bull-gm531163035-55312452_XtraLarge.jpg)
US Dollar: Mar '23 USD is Down at 102.935.
Energies: Mar '23 Crude is Down at 78.93.
Financials: The Mar '23 30 Year T-Bond is Up 15 ticks and trading at 127.27.
Indices: The Mar '23 S&P 500 emini ES contract is 43 ticks Higher and trading at 4158.00.
Gold: The Apr'23 Gold contract is trading Up at 1869.40. Gold is 59 ticks Higher than its close.
Initial conclusion
This is not a correlated market. The dollar is Down, and Crude is Down which is not normal, but the 30 Year T-Bond is trading Higher. The Financials should always correlate with the US dollar such that if the dollar is lower, then the bonds should follow and vice-versa. The S&P is Higher, and Crude is trading Lower which is correlated. Gold is trading Lower which is not correlated with the US dollar trading Down. I tend to believe that Gold has an inverse relationship with the US Dollar as when the US Dollar is down, Gold tends to rise in value and vice-versa. Think of it as a seesaw, when one is up the other should be down. I point this out to you to make you aware that when we don't have a correlated market, it means something is wrong. As traders you need to be aware of this and proceed with your eyes wide open. Currently Asia is trading mainly Higher with the exception of the Hang Seng and Singapore exchanges which are trading Lower. At the present time all of Europe is trading Higher.
Possible challenges to traders today
-
NFIB Small Business Index is out at 6 AM EST. Major.
-
CPI m/m is out at 8:30 AM EST. This is Major.
-
CPI y/y is out at 8:30 AM EST. This is Major.
-
Core CPI m/m is out at 8:30 AM EST. Major.
-
CB Leading Index m/m is out at 9:30 AM EST. Major.
-
FOMC Member Logan Speaks at 11 AM EST. Major.
-
FOMC Member Harker Speaks at 11:30 AM EST. Major.
-
FOMC Member Williams Speaks at 2:05 PM EST. Major.
Treasuries
Traders, please note that we've changed the Bond instrument from the 30 year (ZB) to the 10 year (ZN). They work exactly the same.
We've elected to switch gears a bit and show correlation between the 10-year bond (ZN) and the S&P futures contract. The S&P contract is the Standard and Poor's, and the purpose is to show reverse correlation between the two instruments. Remember it's likened to a seesaw, when up goes up the other should go down and vice versa.
Yesterday the ZN hit a High at around 10 AM EST. The S&P was trading Lower at around the same time. If you look at the charts below ZN gave a signal at around 10 AM and the S&P gave a signal at around the same time. Look at the charts below and you'll see a pattern for both assets. ZN hit a High at around 10 AM and migrated Lower. These charts represent the newest version of MultiCharts and I've changed the timeframe to a 15-minute chart to display better. This represented a Short opportunity on the 10-year note, as a trader you could have netted about a dozen plus ticks per contract on this trade. Each tick is worth $15.625. Please note: the front month for the ZN is now Mar '23. The S&P contract is now Mar' 23 as well. I've changed the format to filled Candlesticks (not hollow) such that it may be more apparent and visible.
Charts courtesy of MultiCharts built on an AMP platform
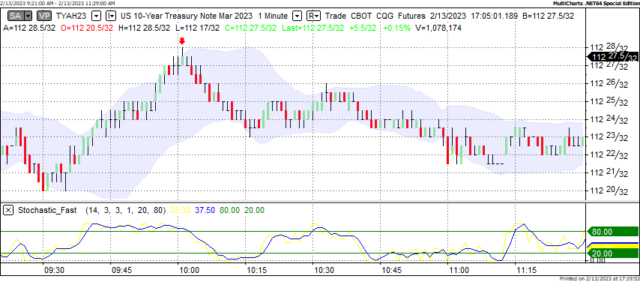
ZN - Mar 2023 - 2/13/23
-638119727577465446.png)
S&P - Mar 2023 - 2/10/23
Bias
Yesterday we gave the markets a Neutral bias as we saw no evidence of market correlation Monday morning. The markets traded Higher with the Dow gaining 377 points and the other indices traded Higher as well. Today we aren't dealing with a correlated market and our bias is to the Upside.
Could this change? Of Course. Remember anything can happen in a volatile market.
Commentary
Yesterday we gave the markets a Neutral bias as we didn't see much in the way of correlation Monday morning. The markets finally traded Higher with the Dow gaining 377 points and the other indices gained ground as well. Today we have key inflation data in the form of CPI numbers and throes numbers are now being broken by month and year. These numbers now play an important role in determining not only inflation data but also give insight as to what the Fed will do regarding interest rates going forward.
Author

Nick Mastrandrea
Market Tea Leaves


