The breakout that’s really important for Gold

Since the gold market now shows parallels to 2008 and 2013, what can we expect if the correction has just ended?
The USDX's breakout
The changes that we saw on the charts yesterday were not enough to change anything that I described yesterday, so those comments remain up-to-date. Also, what I covered during yesterday’s live event (I combined the live market analysis with the presentation about the top 3 gold trading techniques – you can see the recording here) remains up-to-date at the moment of writing these words.
So far today, gold and silver have moved a bit lower, while the USD Index moved a bit higher.
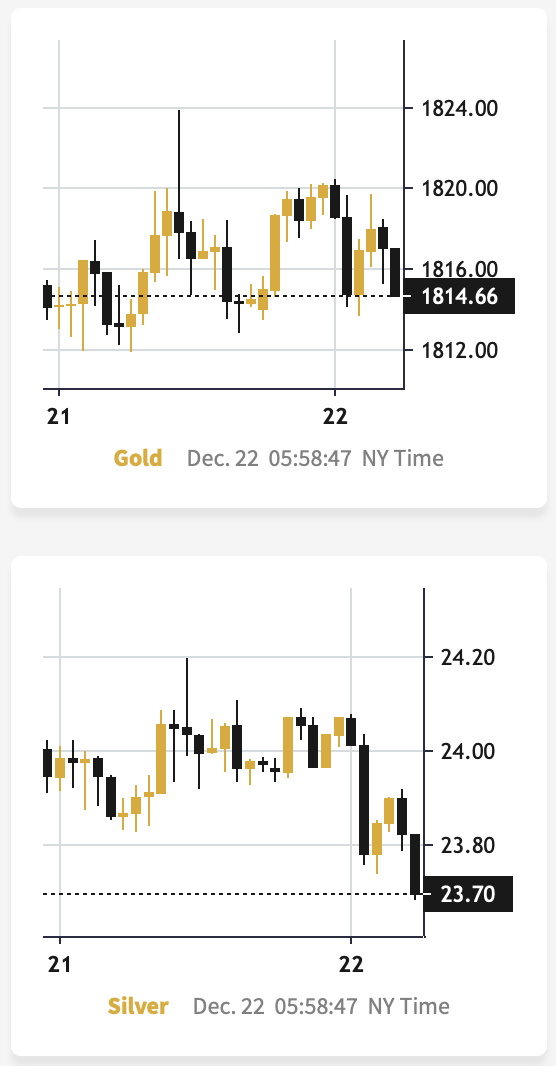
After yesterday’s intraday reversal, both precious metals moved lower. The silver price once again failed to move above the $24 level.
And the USD index?
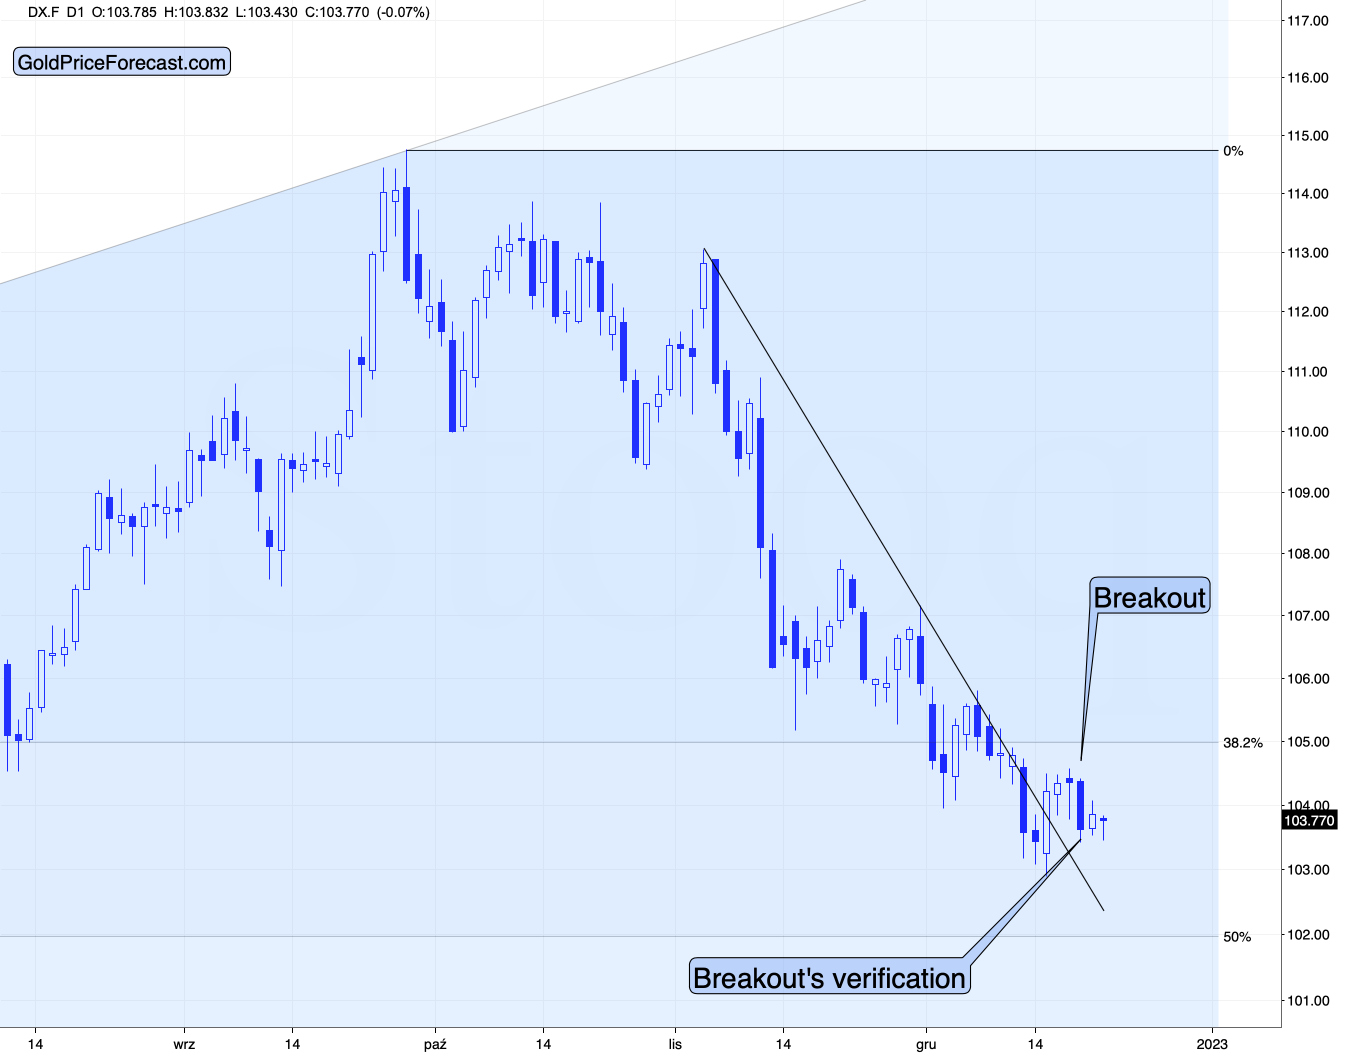
At the moment of writing these words, it’s after an overnight reversal and after a confirmed breakout above its declining resistance line.
This means that it’s now likely to move higher.
Please keep in mind that both markets, the USDX and the precious metals market, have been very strongly negatively correlated recently (with the exception of the very recent yen-related turmoil). Consequently, analyzing the gold price, USDX, and their correlation implies very bearish implications for the PMs and miners.
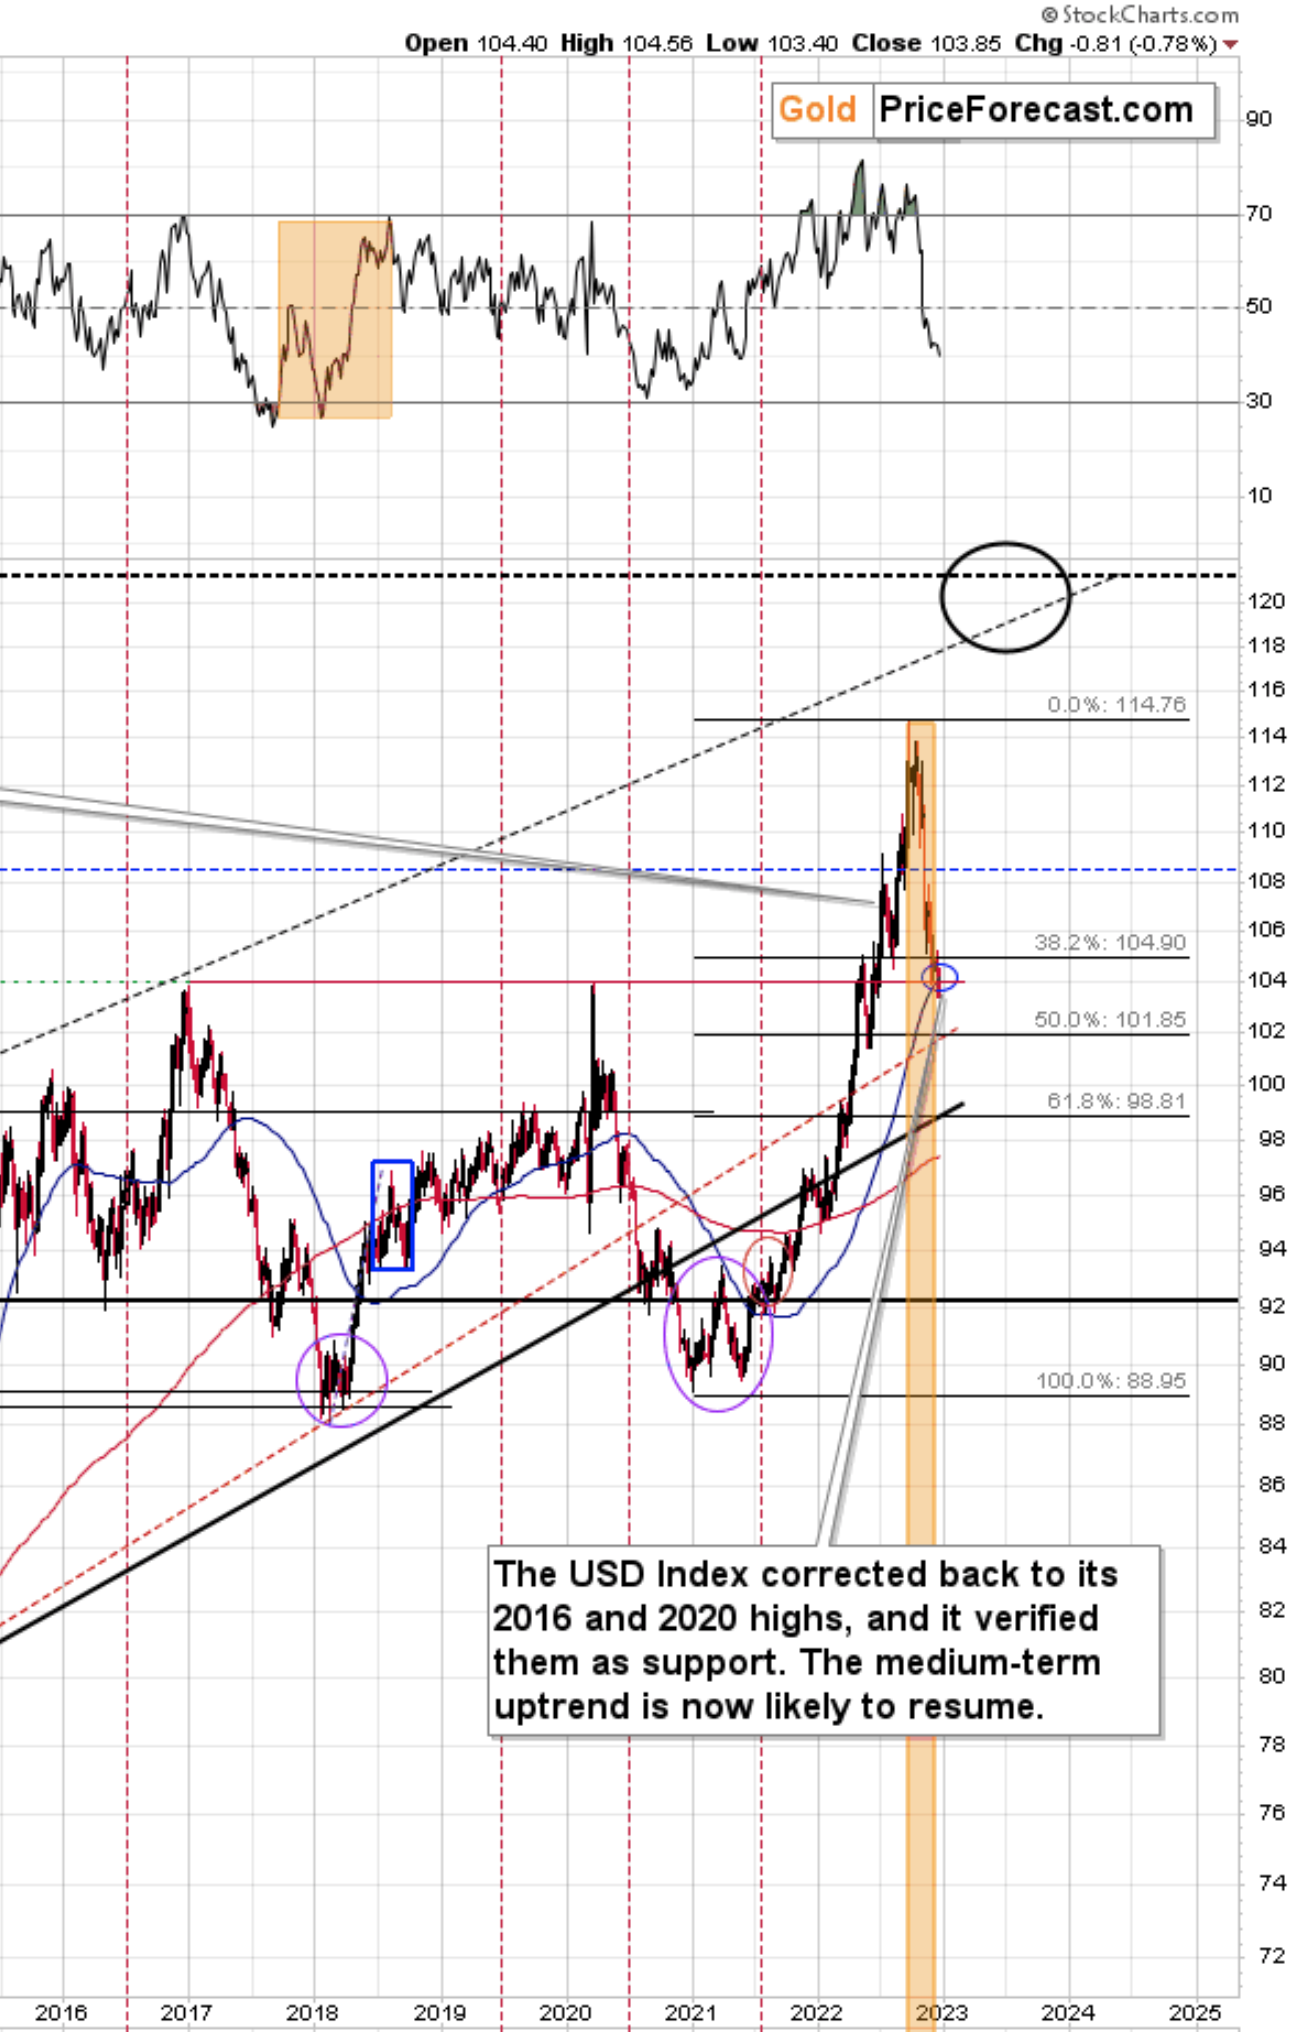
From the long-term point of view, it’s clear that the long-term support remains intact. The relatively small move lower that we saw this week didn’t take the USDX to new short-term lows.
There was no breakdown below the 2016 and 2020 highs in terms of the closing prices, which means that the odds for a turnaround and a rally are very high.
What can happen to Gold miners?
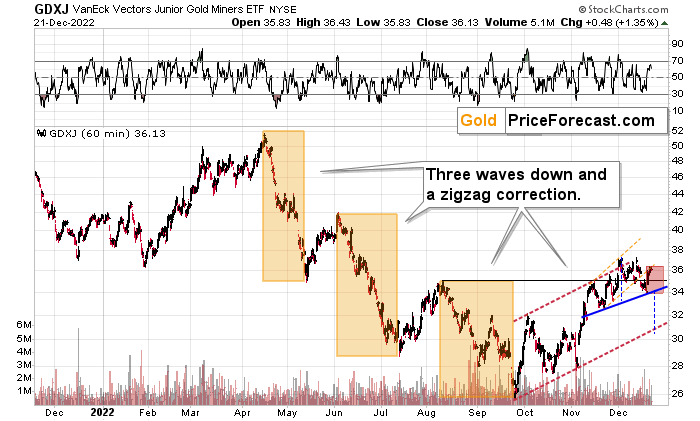
Meanwhile, junior gold and silver mining stocks moved a bit higher yesterday, but they haven’t moved above the lower border of the accelerated trend channel (marked with orange). This means that this week’s upswing was likely just a verification of the breakdown below it.
Interestingly, if we see a decline soon, which is likely, it could become the right shoulder of a potential head-and-shoulders pattern. I marked the theoretical right shoulder with a red rectangle and the neck level with a blue rectangle.
In short, when we see a confirmed breakdown below $34 in the GDXJ, we’re likely to see a move even lower – to $30.5 or so. Then, I’d expect to see something similar to what we saw in August, earlier this year – a small correction that is followed by another decline.
Want free follow-ups to the above article and details not available to 99%+ investors? Sign up to our free newsletter today!
Want free follow-ups to the above article and details not available to 99%+ investors? Sign up to our free newsletter today!
Author

Przemyslaw Radomski, CFA
Sunshine Profits
Przemyslaw Radomski, CFA (PR) is a precious metals investor and analyst who takes advantage of the emotionality on the markets, and invites you to do the same. His company, Sunshine Profits, publishes analytical software that any


