The big picture

S2N spotlight
I mentioned yesterday that I was out at a client for most of the day.
For the last few years I have been working from home, which has eliminated a commute. I have also entered the world of coding for a big chunk of my day. In all, the benefits I have gained are enormous, but one of the big casualties of my day has been listening to podcasts and long-form reading.
My 26-year-old daughter said to me last night, “You are such a nerd,” as I carried a huge box of books I was giving away. I love reading, and reading loves me. It just seems that my day is so full of glimpses of this and that but not the kind of reading that builds real wisdom. This morning I treated myself to more quality reading than I have in a while.
Yesterday, driving 90 minutes each way to a client gave me the chance to listen to a number of podcasts. The reason for this introduction is sometimes it is important to take a step back and see the big picture.
Let me summarise the biggest challenge facing the capital markets in the US right now.
"This Time Is Different: Eight Centuries of Financial Folly" by Carmen Reinhart and Kenneth Rogoff examines the recurring patterns in financial crises across countries and centuries. Oy vey, I look older than Methuselah. The book's central insight is that despite claims that "this time is different" before each new crisis, financial disasters follow remarkably similar patterns.
The authors analyse data spanning 800 years of financial history to show how countries repeatedly fall into the same traps of excessive debt, banking crises, currency devaluations, and sovereign defaults. They demonstrate that financial crises typically arise from similar causes: rapid debt accumulation, asset price bubbles, and the belief that old economic rules no longer apply due to supposed innovations or improved policies.
If any of the above sounds familiar, then this is a good place to start to see what we have in front of us. To save you the effort of wading through a few hundred pages of economics that most of you will find more thrilling than going to the dentist, the central thesis is that when a government’s debt goes above 100%, it is the beginning of the end.
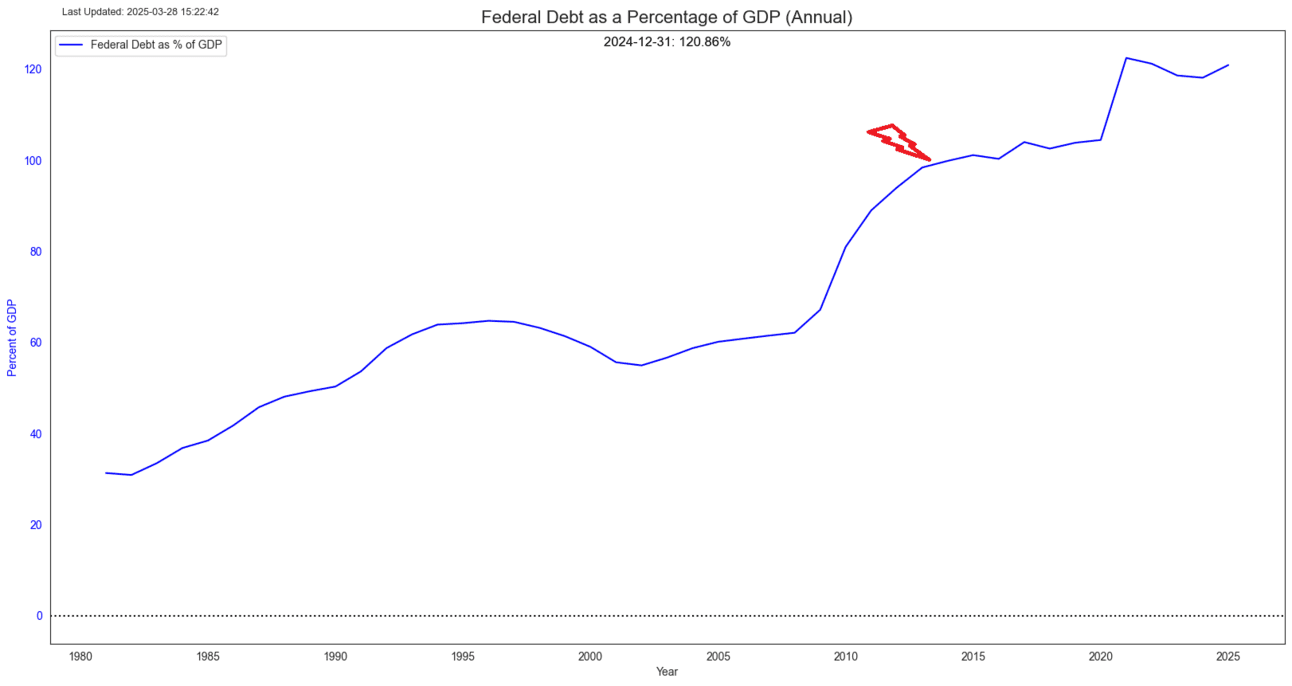
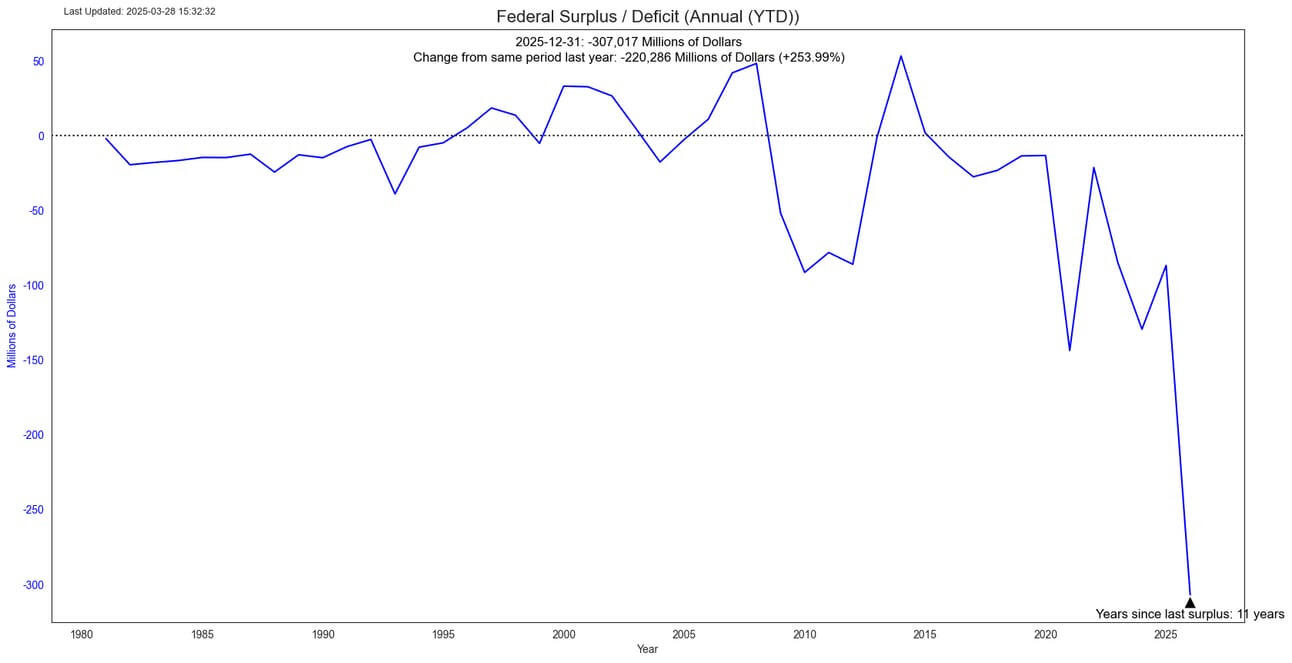
This equates to a total of $37 trillion. The issue is that there is $10 trillion that needs to be refinanced this year and a total of $26 trillion over the next 4 years. But that assumes no new debt is taken on. For the foreseeable future, the federal deficit is likely to be around $2 trillion a year unless DOGE performs a greater miracle than splitting the Red Sea. Speaking of which, if you go check the news over the last few hours, the US military has been busy in that neck of the woods.
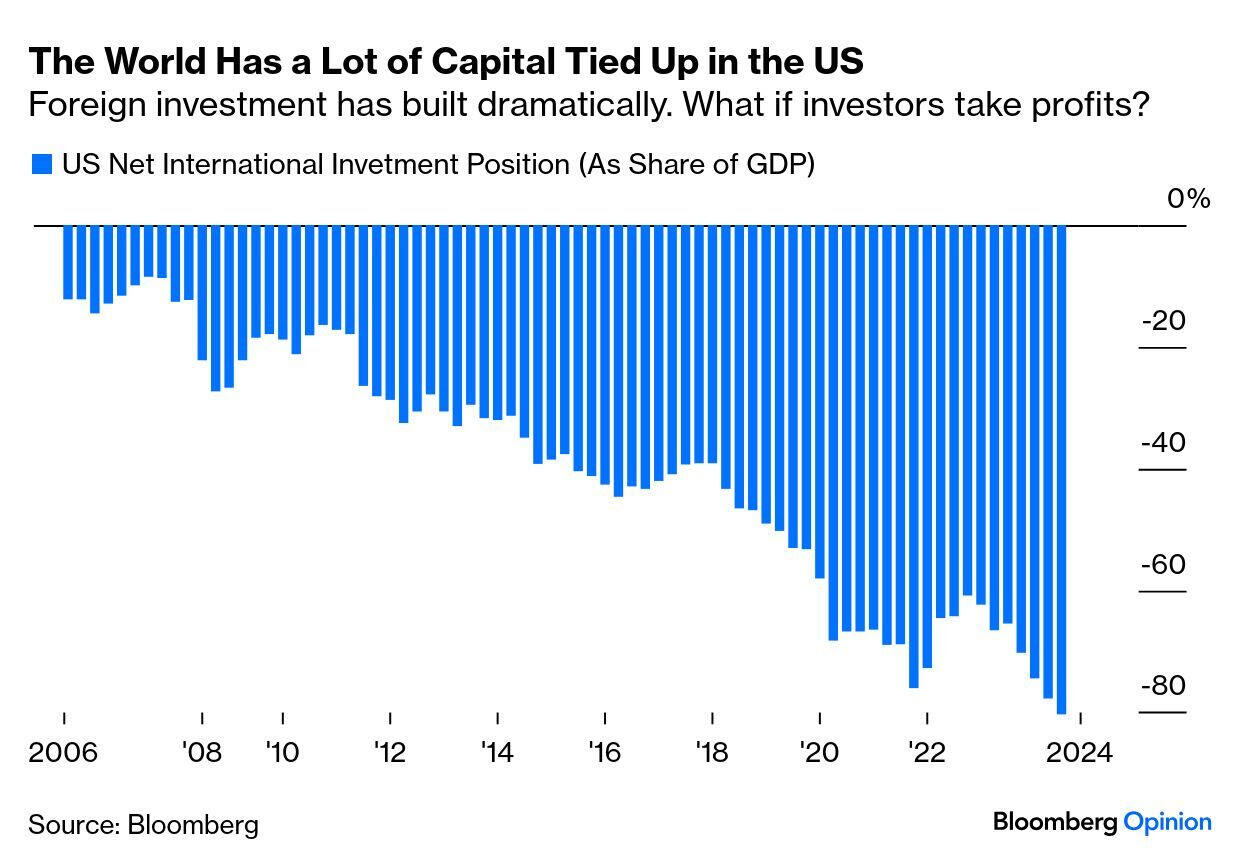
Stay with me I promise to bring this home soon. The chart below shows the Net International Investment Position (NIIP) as a percentage of GDP, which measures how much a country’s residents (households, firms, and government) collectively own in foreign assets minus how much they owe in foreign liabilities—scaled by the country’s economic output (GDP).
For the United States, the NIIP has been negative for decades, indicating that the U.S. has more liabilities (such as U.S. bonds and equity held by foreigners) than assets owned abroad by U.S. entities. These are not the greatest set of cards to play the next refinancing of treasuries with.
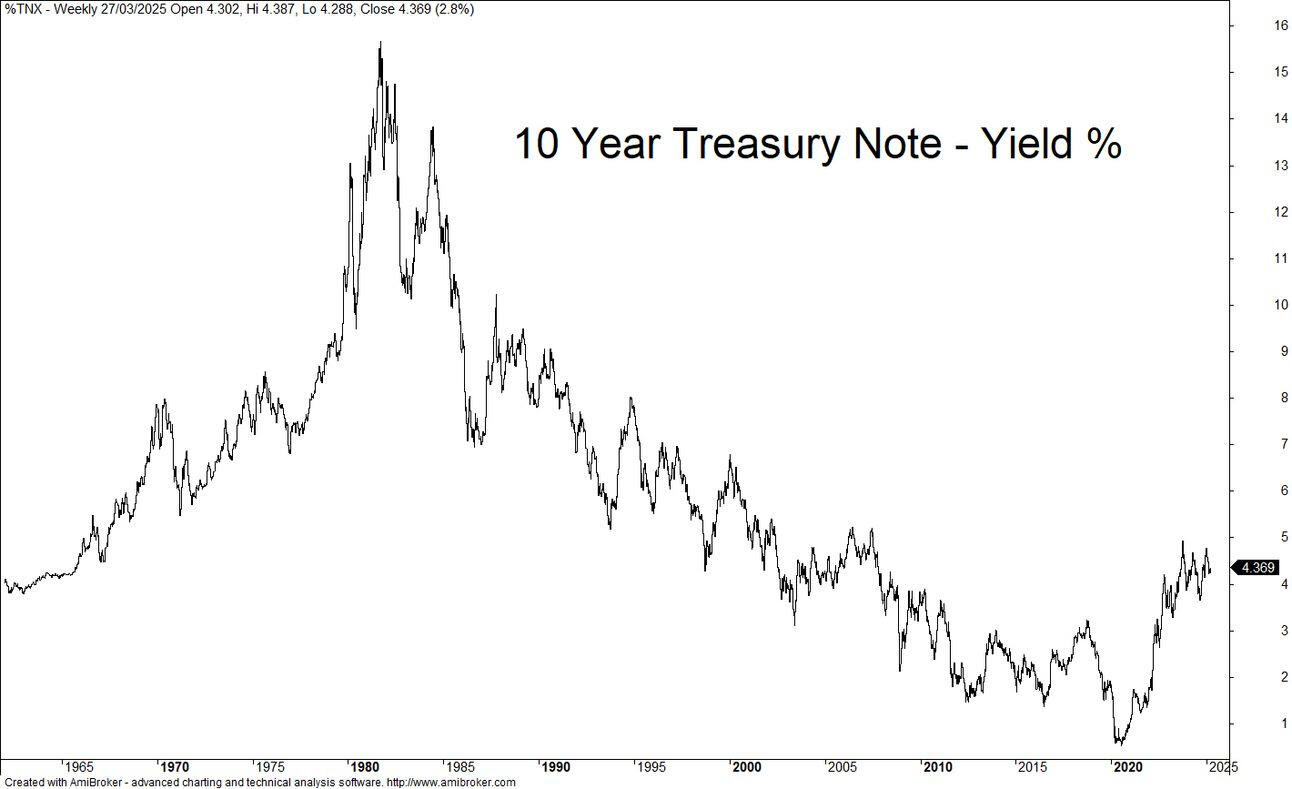
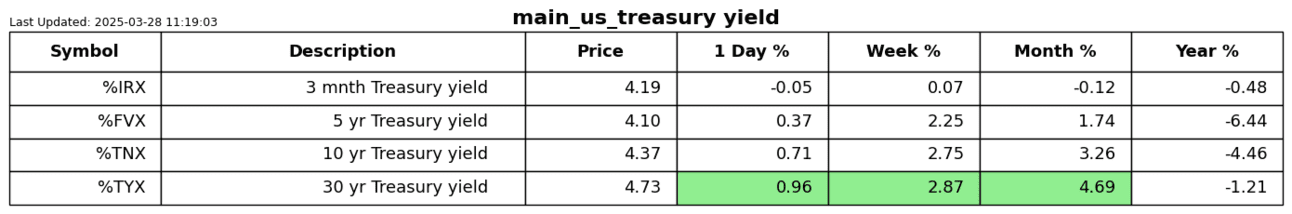
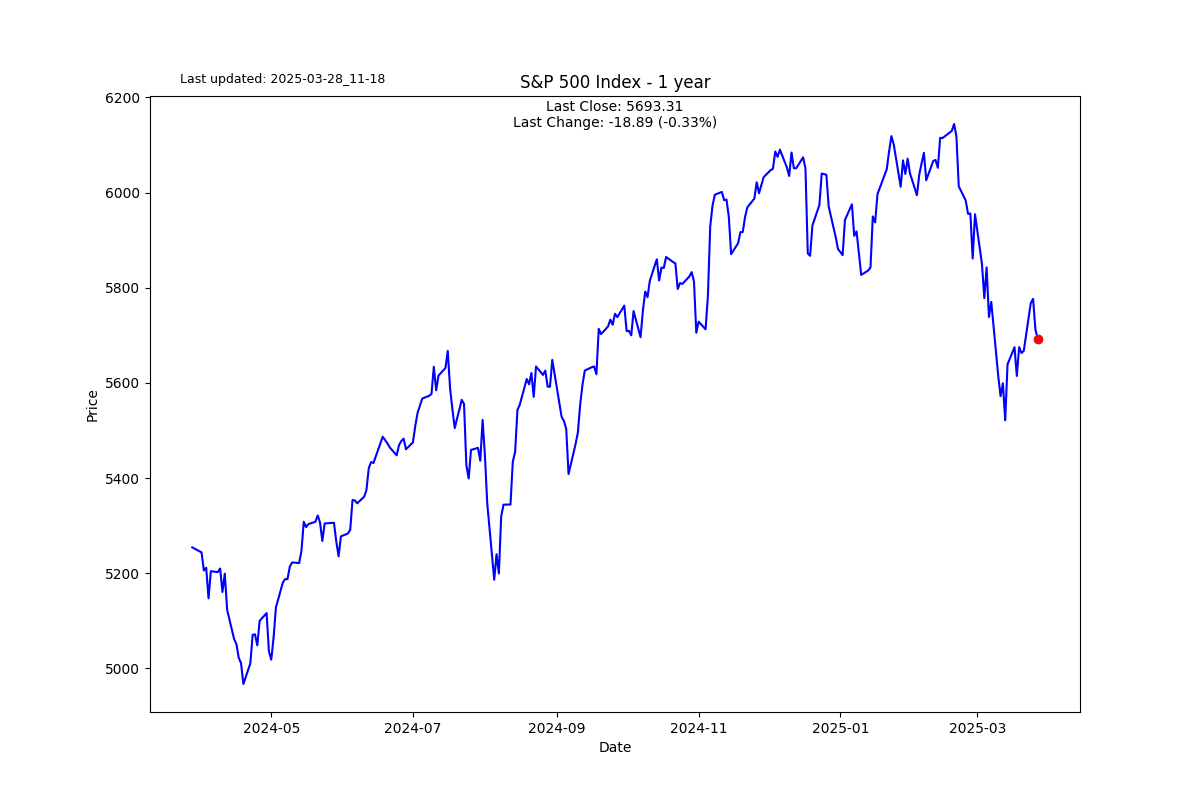
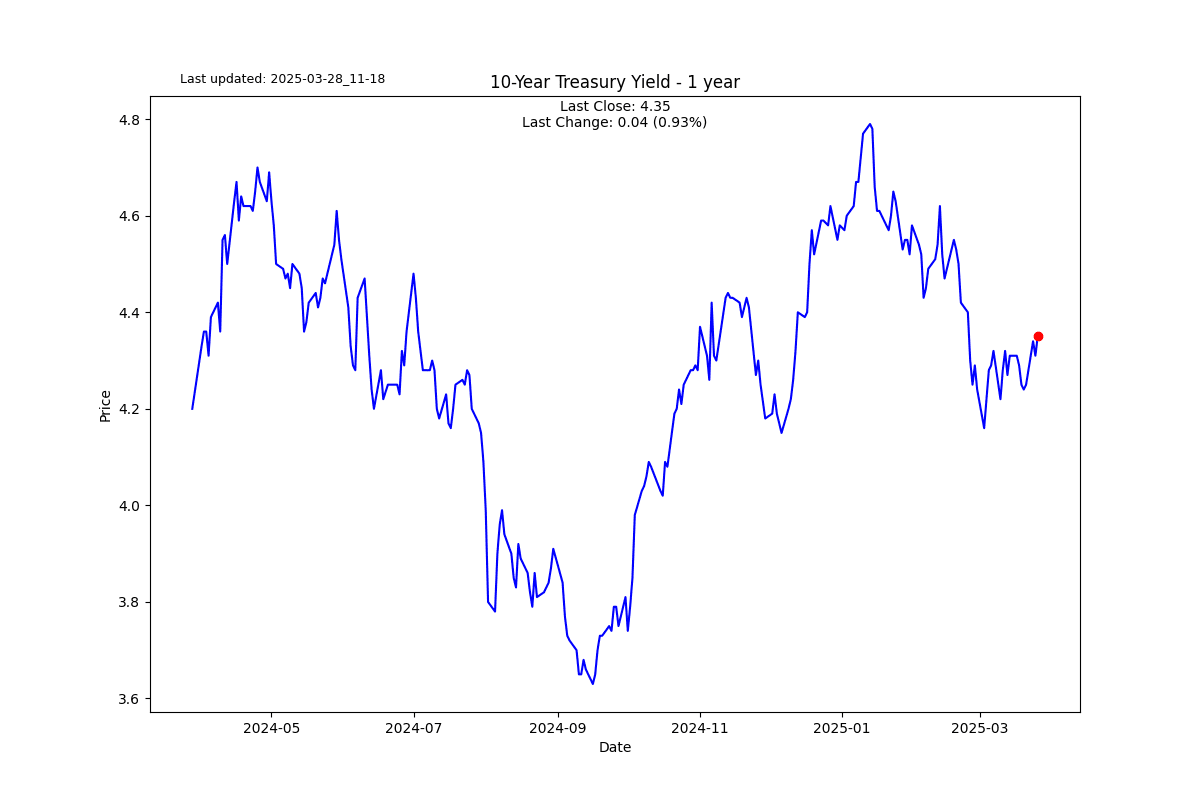
So I ask you in all seriousness, where do you think bond yields are going in the US?
Many of the people shaping the economy today don’t read economic history or are not old enough to remember a world where interest rates were much higher. We have had 40-plus years of interest rates trending lower. That is a multigenerational imprint on the psyche of the world.
At last week’s Fed press conference, a reporter asked Chair Powell about tariffs’ inflationary effects. Firstly, I couldn’t believe he used words like transitory again, but listen to his BS response.
“As I mentioned, it can be the case that it’s appropriate sometimes to look through inflation if it’s going to go away quickly without action by us if it’s transitory, and that can be the case in the case of tariff inflation.”
So you can see clearly where the Fed is on all of this. They are going to once again play catch-up instead of managing the economy to the best of their ability. The Fed is meant to be an independent body, but it is clear to me they are shills of the government.
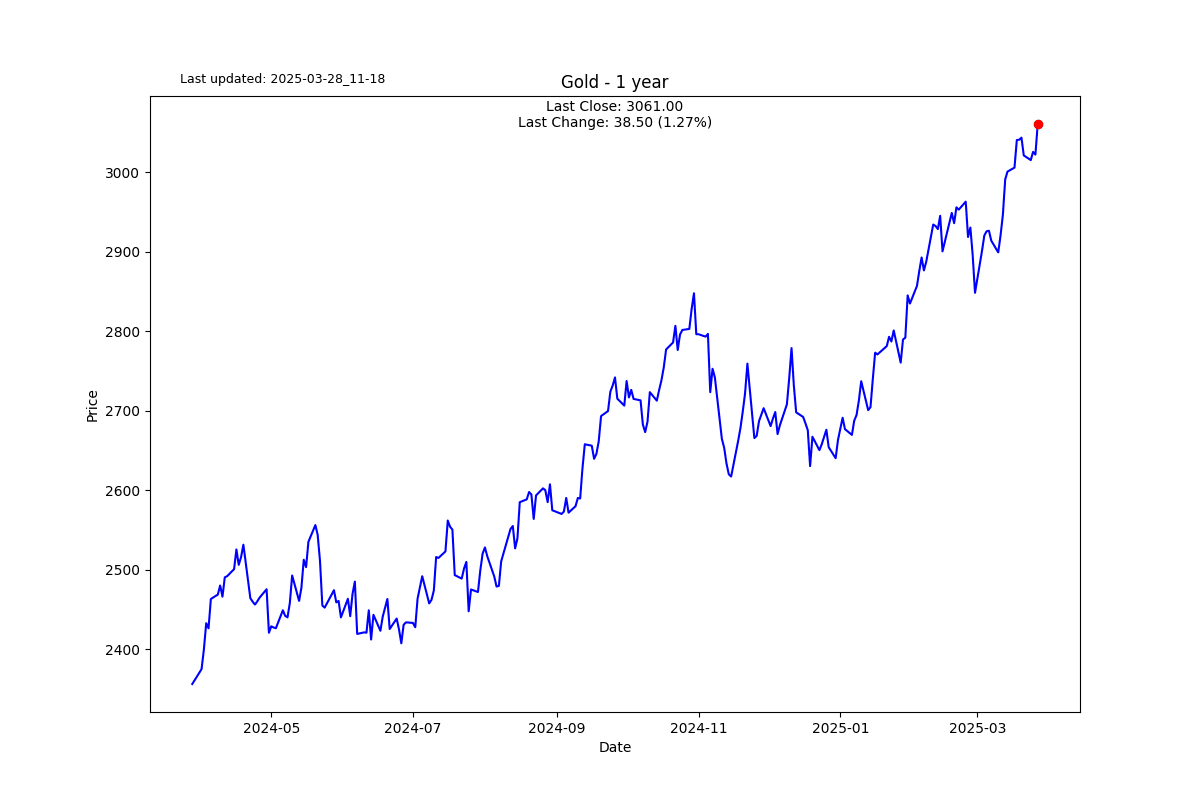
The “Maestro” (Alan Greenspan), don’t get me started, at least used to watch the gold price closely and would use it as a proxy to see if he was getting monetary policy right.
Bring it home, Mike; you have made your point.
I see higher interest rates as the only way to refinance the enormous debt load. This will be a disaster for the economy as it will slow down a slowing down economy. I believe we are going to see the fiscal debt grow as a % of GDP way higher than we have right now. Yesterday the Congressional Budget Office released its budget forecasts for 2025 to 2055. They project the debt held by the public to be 156% of GDP; that is not including the debt held by the Fed and other government apparatuses, so debt growth of more than 50%.
S2N observations
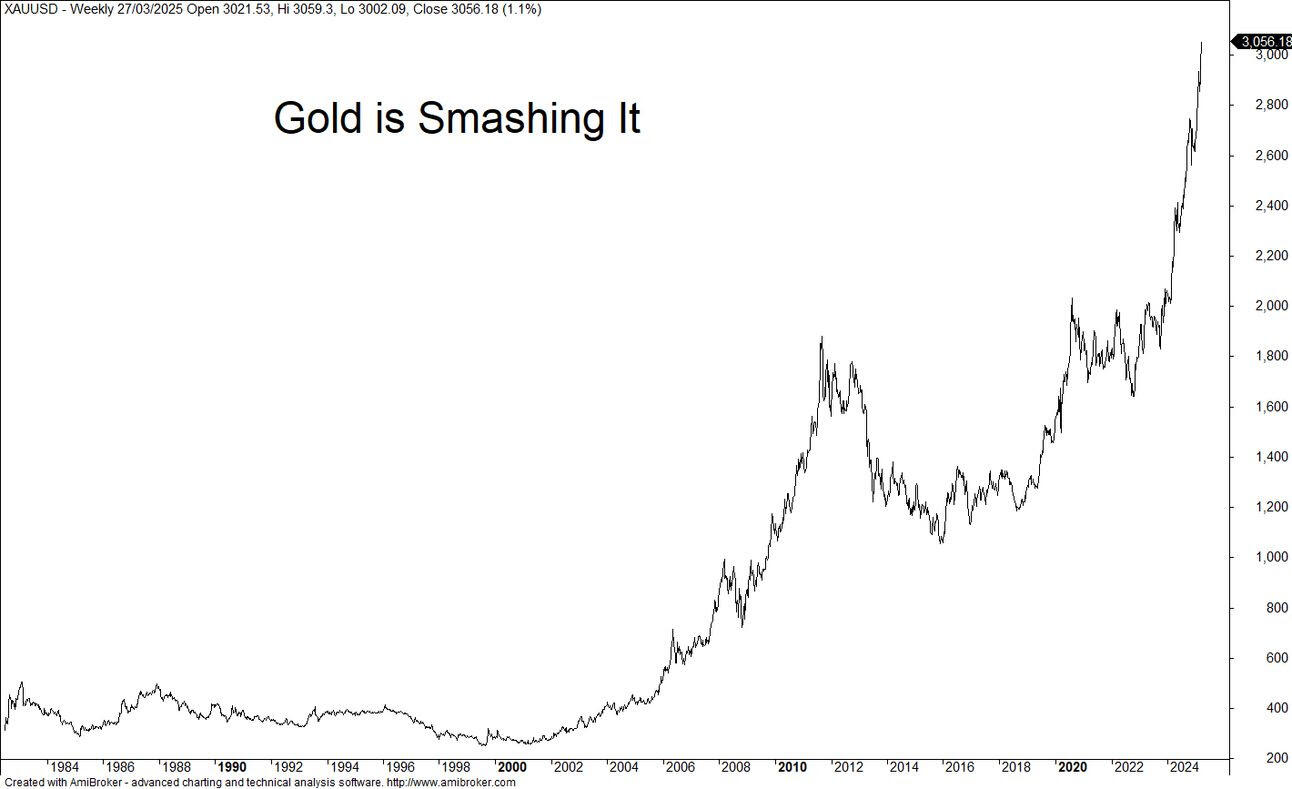
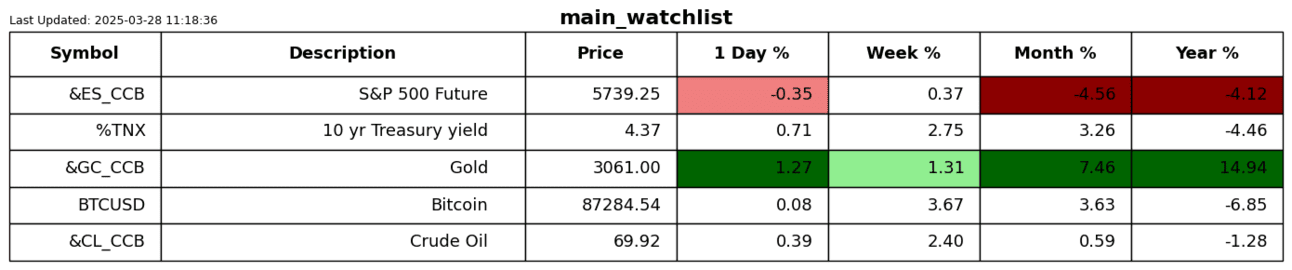
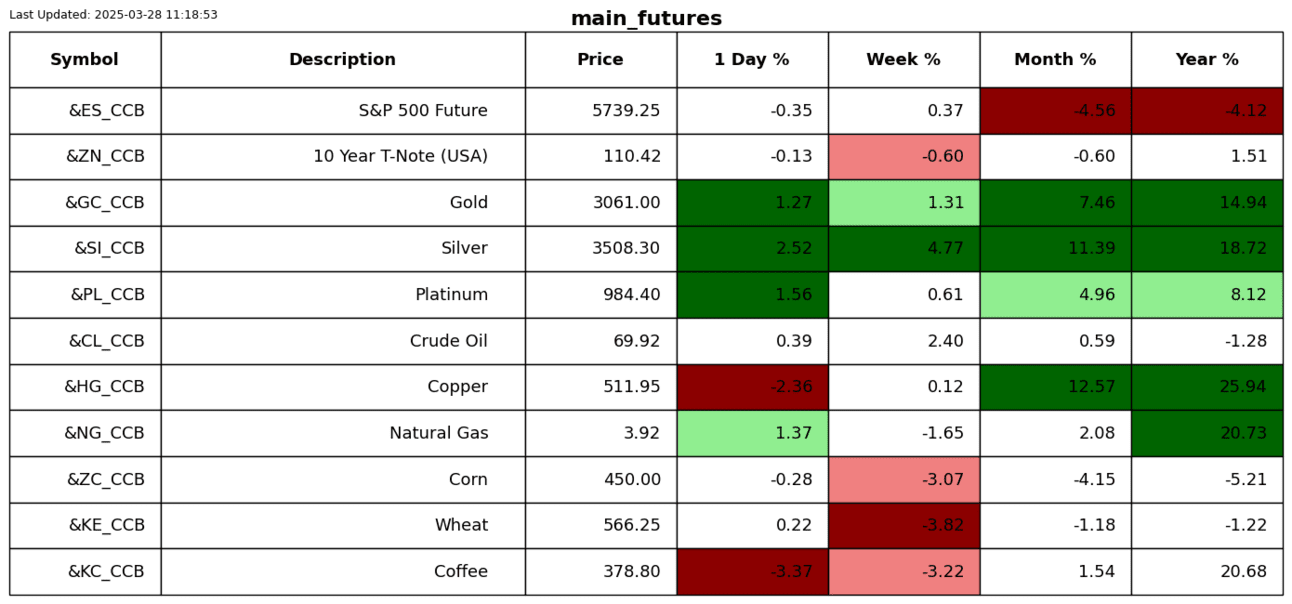
Is it any surprise that Gold made another meaningful new high yesterday.
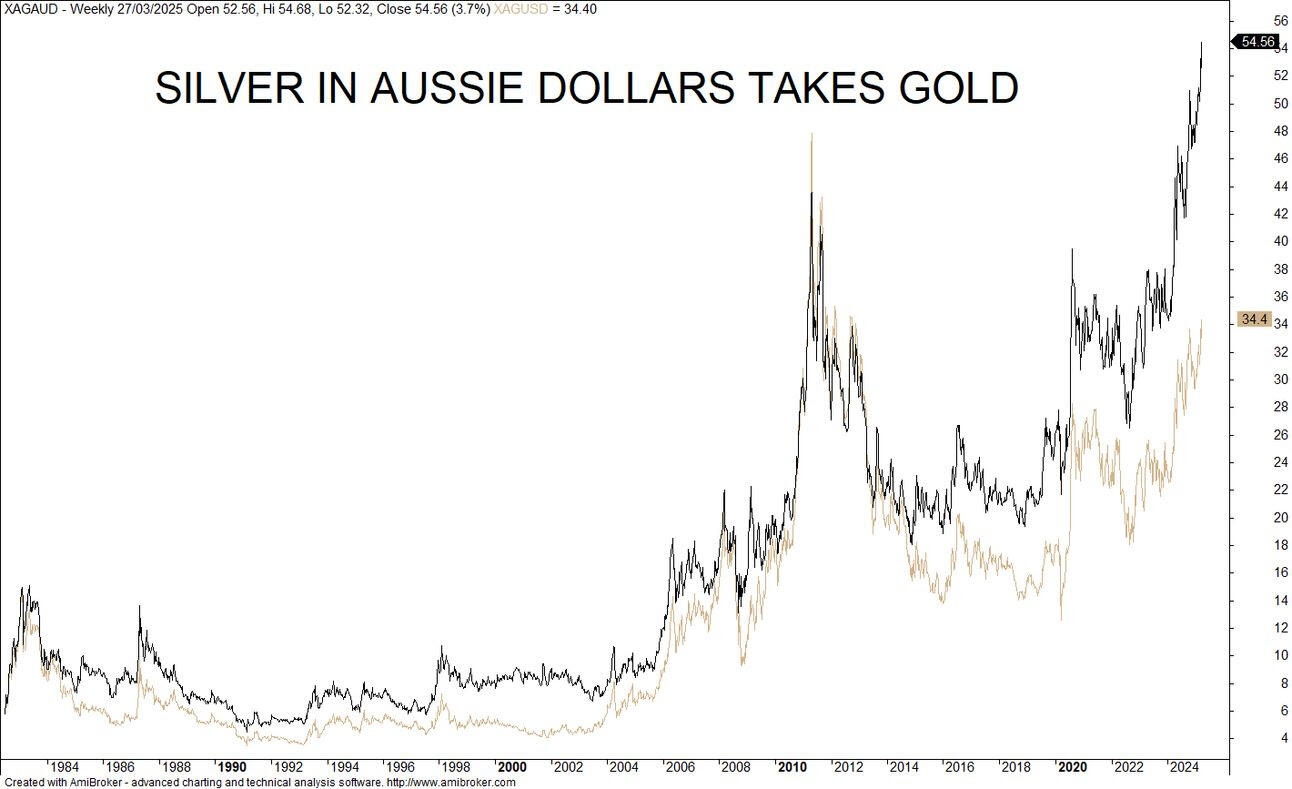
A few days ago I mentioned that silver has some catching up to do with gold as it is still well below its all-time high from 15 years ago. Well, silver in Australian dollars is making all-time highs.
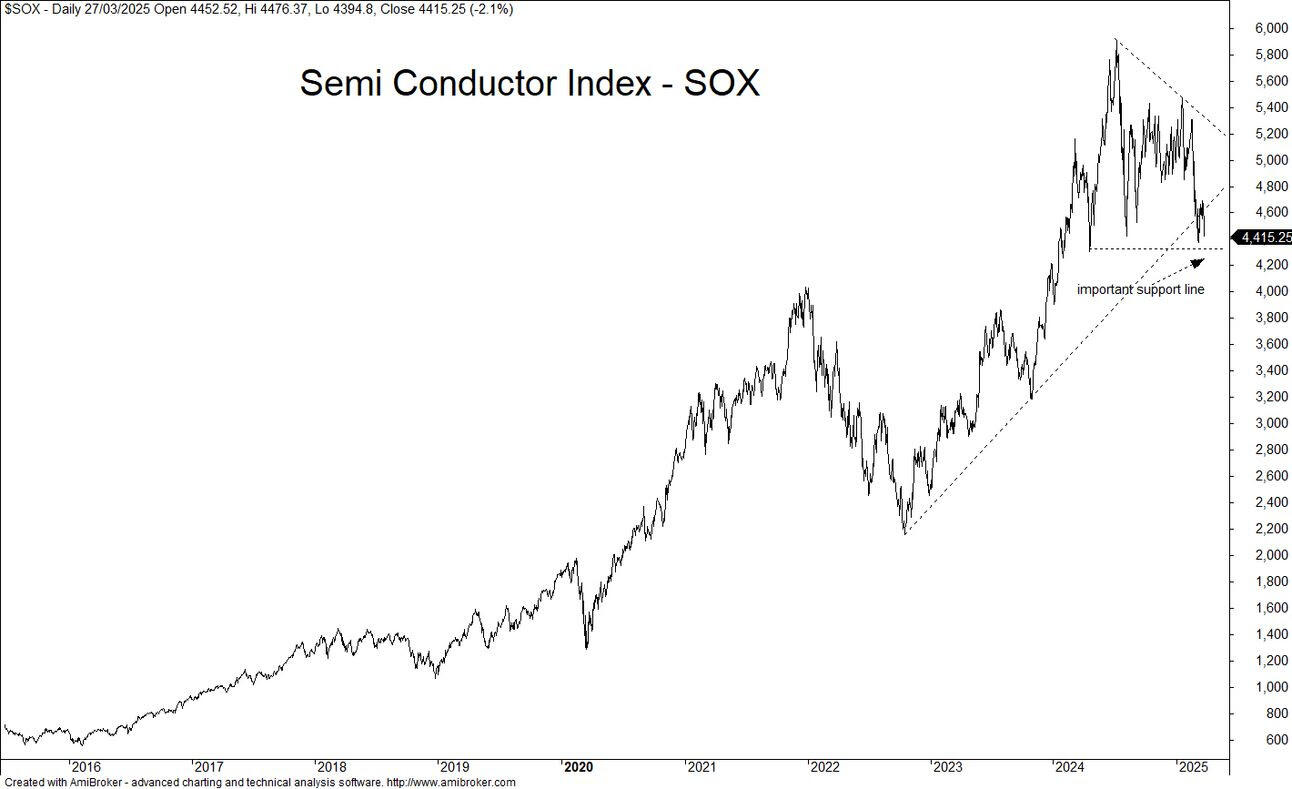
Wow, today’s letter keeps going, unlike the semiconductor index. Keep an eye on this index, as so much of today’s hype is riding on the back of AI. This week OpenAI released the latest version of ChatGPT that is able to do cool stuff with images. Sam Altman was on his socials today telling the world that the ChatGPT servers are melting due to the playing with the images feature.
Let me leave you with something to think about over the weekend. Hat tip to Lynne Alden for this info.
The brain runs on only about 20 watts of power. That’s less than an incandescent lightbulb. In comparison, the top supercomputers that rival the human brain in terms of estimated calculations per second currently run at over 20 megawatts, or about a million times as much power. They take up about as much floor space as a large mansion.
Mike - What is your point?
My point is that chips (semiconductors) might be keeping up with Moore’s Law, but try to figure out how these AI companies are going to make a profit. Moore to think about (did you get it - lol ).
S2N screener alert
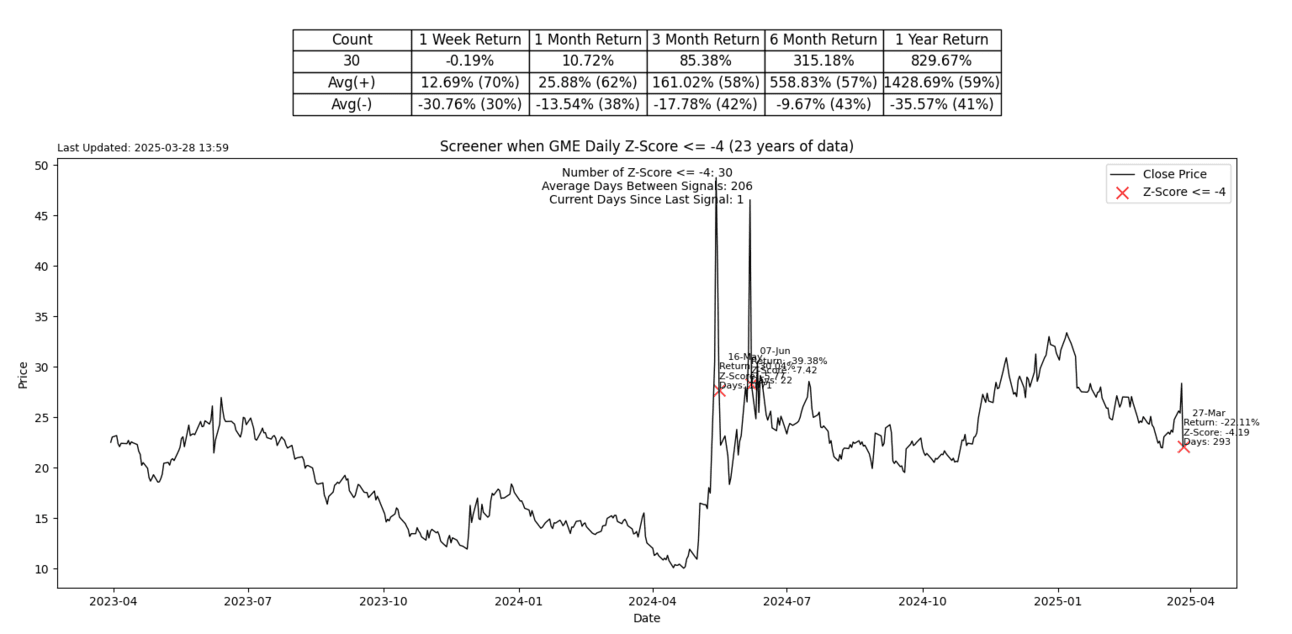
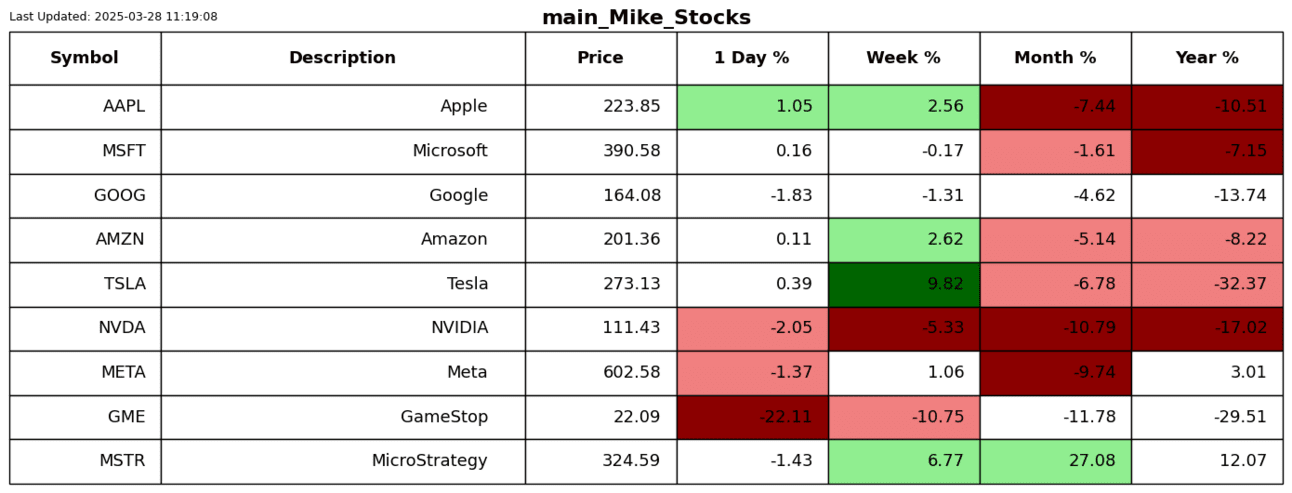
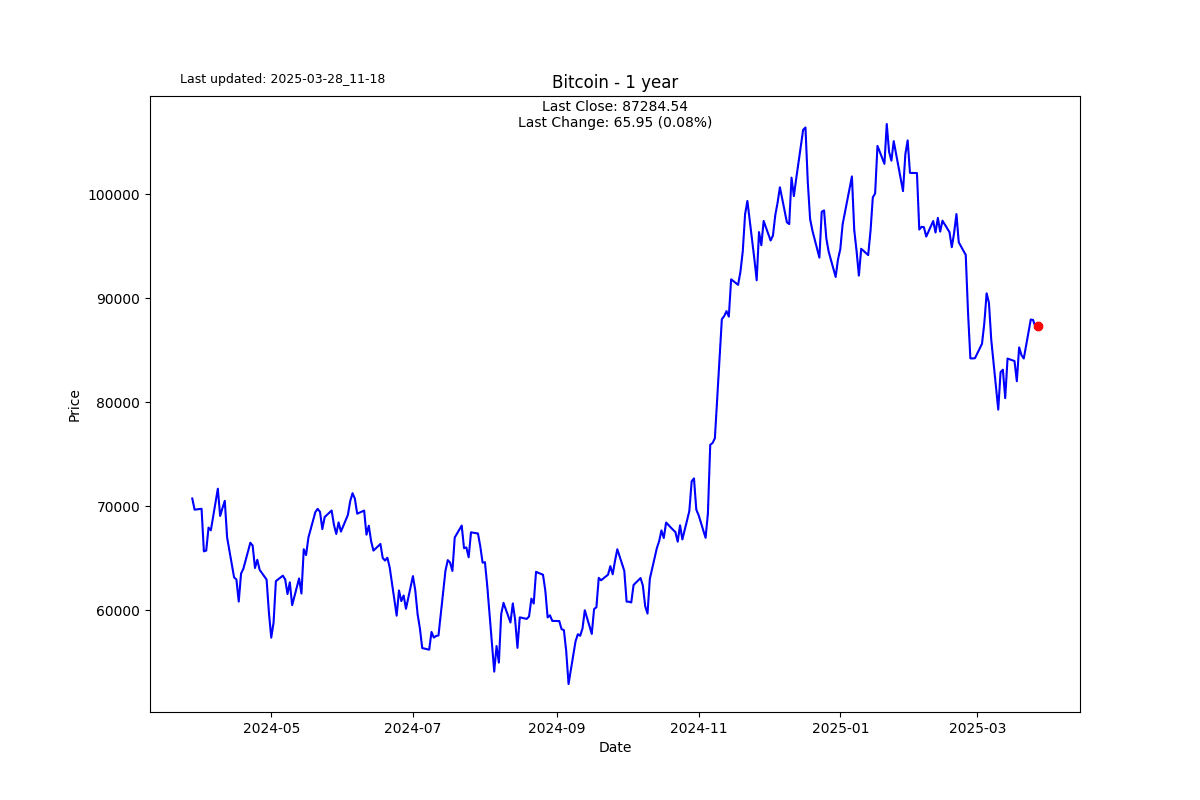
Gamestop released its results a few days ago, and in typical obfuscation they announced that they will be buying Bitcoin à la MicroStrategy. The market seemed to like it, then yesterday produced a 4-sigma down day. Down 22%.
The really crazy thing is that there have been 30 times that the stock has dropped 4 sigma in a day over 23 years worth of data.
I promise this is the last, as even I am trying to get rid of myself.
It seems like not all dictatorships are the same. Here is the textbook version of a benevolent dictator.
S2N performance review
S2N chart gallery
S2N news today
Author

Michael Berman, PhD
Signal2Noise (S2N) News
Michael has decades of experience as a professional trader, hedge fund manager and incubator of emerging traders.


