|

Technical analysis – WTI Crude Oil eases after bullish wave [Video]

  • WTI crude oil breaks significant level of 68.90.

  • Technical oscillators suggest negative momentum.

Chart

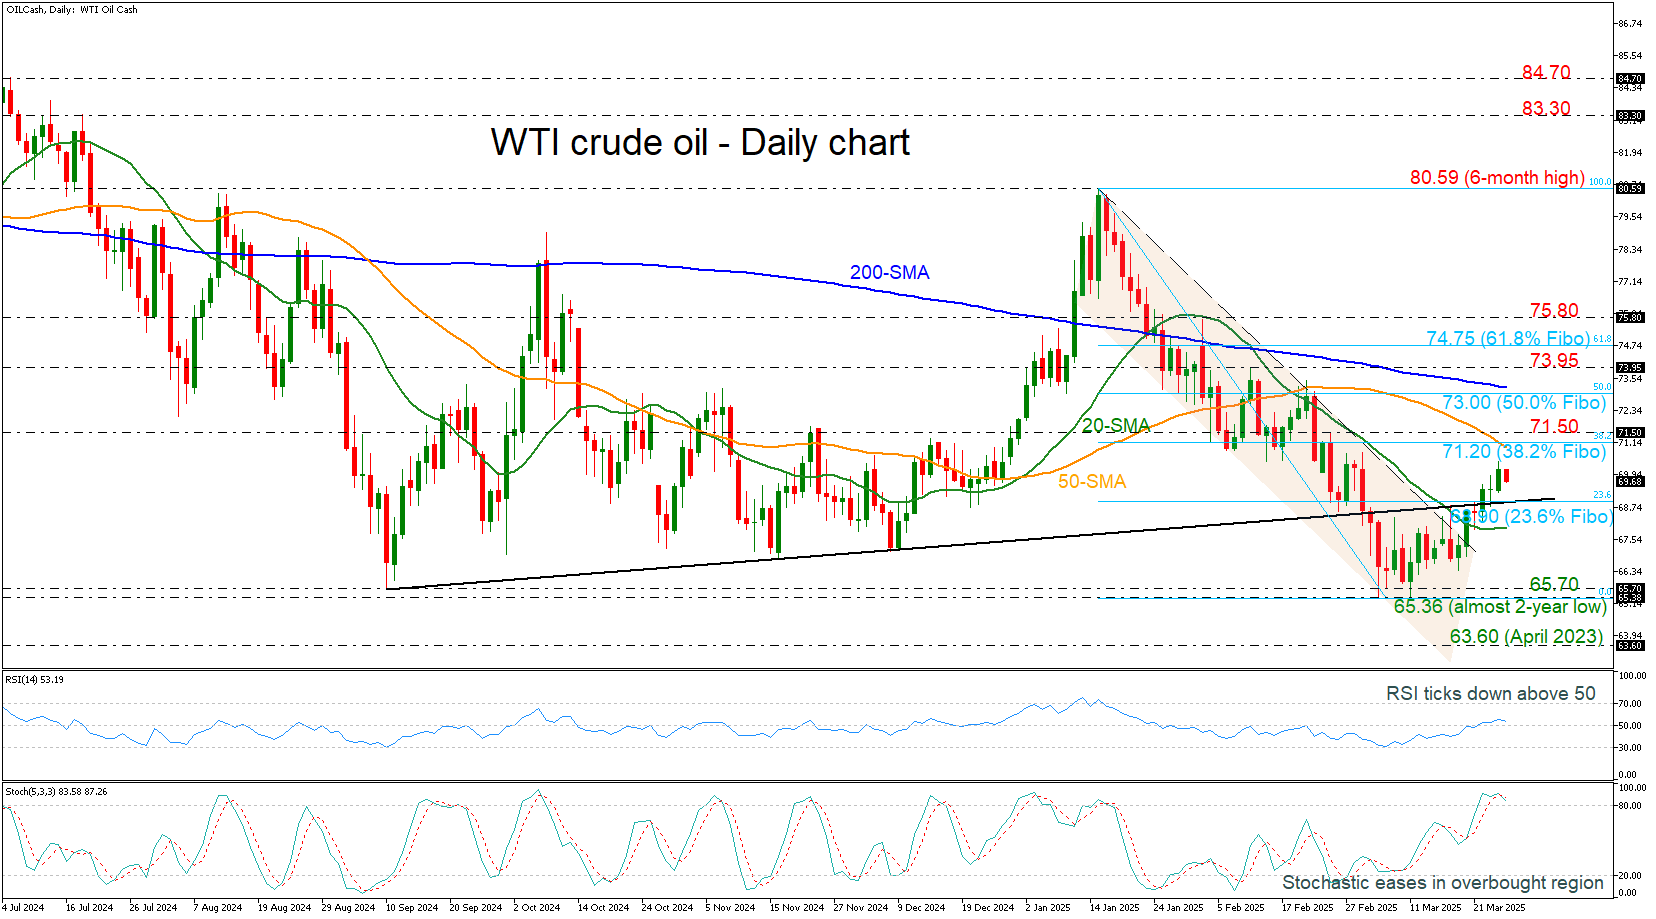
WTI crude oil has gained some notable ground after the selling interest toward the almost two-year low of 65.36, surpassing the crucial resistance levels of the 23.6% Fibonacci retracement level of the down leg from 80.59 to 65.36 at 68.90 and the long-term ascending trend line.

However, from a technical perspective, the momentum oscillators show weak movement. The RSI is pointing slightly down above the 50 territory, while the stochastic posted a bearish crossover between its %K and %D lines in the overbought region.

If the commodity falls below 68.90, it may challenge the 20-day simple moving average (SMA) at 68.00 before entering the descending channel. Lower, the 65.70 and 65.36 supports may cause negative actions.

On the other hand, a continuation of the up leg could reclaim the 38.2% Fibonacci of 71.20, which holds near the 50-day SMA, before battling with the 71.50 barrier. If the bulls continue to buy, the 50.0% Fibonacci and the 200-day SMA around 73.00 may prove to be tough obstacles.

All in all, WTI crude oil showed some improvement in the preceding days, but the technical oscillators suggest a negative bias.

Author

Melina Deltas, CFTe

Melina joined XM in December 2017 as an Investment Analyst in the Research department. She can clearly communicate market action, particularly technical and chart pattern setups.

More from Melina Deltas, CFTe
Share:

Markets move fast. We move first.

Orange Juice Newsletter brings you expert driven insights - not headlines. Every day on your inbox.

By subscribing you agree to our Terms and conditions.

Editor's Picks

EUR/USD trades with negative bias around 1.1730 amid recovering USD; downside seems limited

The EUR/USD pair kicks off the new week on a softer note, though it remains within striking distance of the highest level since early October, touched last Thursday. Spot prices currently trade around the 1.1730 region, down less than 0.10% for the day.

GBP/USD holds steady above mid-1.3300s as traders await key data and BoE this week

The GBP/USD pair remains on the defensive during the Asian session on Monday, though it lacks bearish conviction and holds above the 200-day Simple Moving Average pivotal support. Spot prices currently trade around the 1.3360 region, nearly unchanged for the day.

Gold regains traction toward $4,350 in the final full week of 2025

Gold price picks up bids once again toward $4,350 in Asian trading on Monday. The precious metal extends its upside to the highest since October 21 amid the prospect of interest rate cuts by the US Federal Reserve next year. The delayed US Nonfarm Payrolls report for October will be in the spotlight later on Tuesday. 

Week ahead: US NFP and CPI, BoE, ECB and BoJ mark a busy week

After Fed decision, dollar traders lock gaze on NFP and CPI data. Will the BoE deliver a dovish interest rate cut? ECB expected to reiterate “good place” mantra. Will a BoJ rate hike help the yen recover some of its massive losses?

Big week ends with big doubts

The S&P 500 continued to push higher yesterday as the US 2-year yield wavered around the 3.50% mark following a Federal Reserve (Fed) rate cut earlier this week that was ultimately perceived as not that hawkish after all. The cut is especially boosting the non-tech pockets of the market.

Aave Price Forecast: AAVE primed for breakout as bullish signals strengthen

Aave (AAVE) price is trading above $204 at the time of writing on Friday and approaching the upper boundary of its descending parallel channel; a breakout from this structure would favor the bulls.

Technical analysis – WTI Crude Oil eases after bullish wave [Video]