Technical Analysis and WHEAT/RUB

Russia and the EU may reduce wheat exports
In this review, we suggest considering the personal composite instrument (PCI) “Wheat vs the Russian Ruble”. It increases when wheat prices rise in the world market and the Russian currency weakens. Is there a possibility for the WHEAT/RUB to rise?
A few messages at once can indicate a possible reduction in the supply of wheat in the world market. According to the European Commission, exports of soft wheat from the EU countries in the 2018/19 agricultural season for the period from July 1 to November 11 amounted to 5.9 million tons, which is 24% less than the level of the previous season for the same period (7.8 million tons). According to the forecast of the Russian agency SovEcon, wheat exports from Russia in November of the current year will be reduced to 4 million tons, which is the minimum volume since July. According to the forecast of the Russian Institute for Agricultural Market Studies (IKAR), wheat exports from Russia in the current agricultural season will be reduced to 33 million tons, compared to 41.3 million in the previous season. This is caused by a decrease in yield. In turn, the weakening of the Russian ruble is observed against the background of declining oil prices. The share of hydrocarbons in Russian exports is approaching 75%. In addition, the Ministry of Finance of the Russian Federation announced that it is considering plans for the devaluation of the ruble to replenish the state budget.
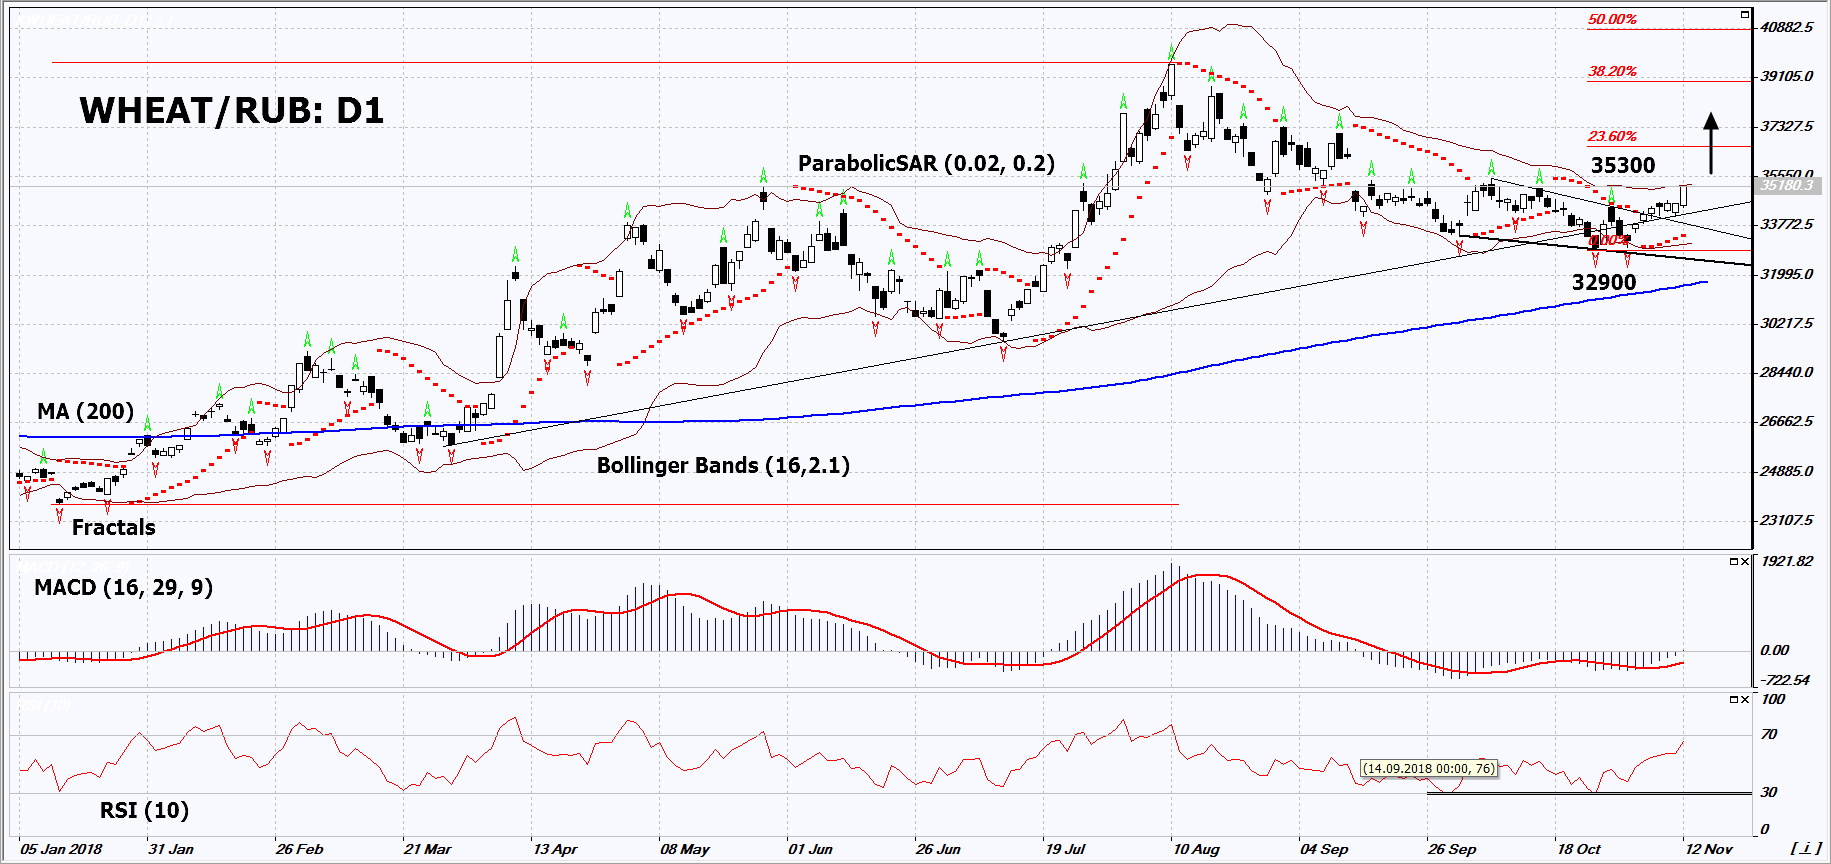
On the daily timeframe, WHEAT/RUB: D1 overcame the resistance line of the short-term downtrend and returned to the long-term uptrend. The further price increase is possible in case of a reduction in the world wheat yield and the devaluation of the ruble.
-
The Parabolic indicator gives a bullish signal.
-
The Bollinger bands have narrowed, which indicates low volatility. Both bands are titled upwards.
-
The RSI indicator is above 50. It has formed a small positive divergence.
-
The MACD indicator gives a bullish signal.
The bullish momentum may develop in case WHEAT/RUB exceeds the upper Bollinger band and the two last fractal highs at 35300.This level may serve as an entry point. The initial stop loss may be placed below the two last fractal lows, the 4-month low, the lower Bollinger band and the Parabolic signal at 32900. After opening the pending order, we shall move the stop to the next fractal low following the Bollinger and Parabolic signals. Thus, we are changing the potential profit/loss to the breakeven point. More risk-averse traders may switch to the 4-hour chart after the trade and place there a stop loss moving it in the direction of the trade. If the price meets the stop level (24700) without reaching the order (26500), we recommend to close the position: the market sustains internal changes that were not taken into account.
Summary of technical analysis
|
Position |
Buy |
|
Buy stop |
Above 35300 |
|
Stop loss |
Below 32900 |
Want to get more free analytics? Open Demo Account now to get daily news and analytical materials.
Want to get more free analytics? Open Demo Account now to get daily news and analytical materials.
Author

Dmitry Lukashov
IFC Markets
Dimtry Lukashov is the senior analyst of IFC Markets. He started his professional career in the financial market as a trader interested in stocks and obligations.


