Technical analysis – USD/JPY, Gold [Video]
![Technical analysis – USD/JPY, Gold [Video]](https://editorial.fxstreet.com/images/Markets/Currencies/Majors/USDJPY/crumpled-us-and-japanese-currency-13375743_XtraLarge.jpg)
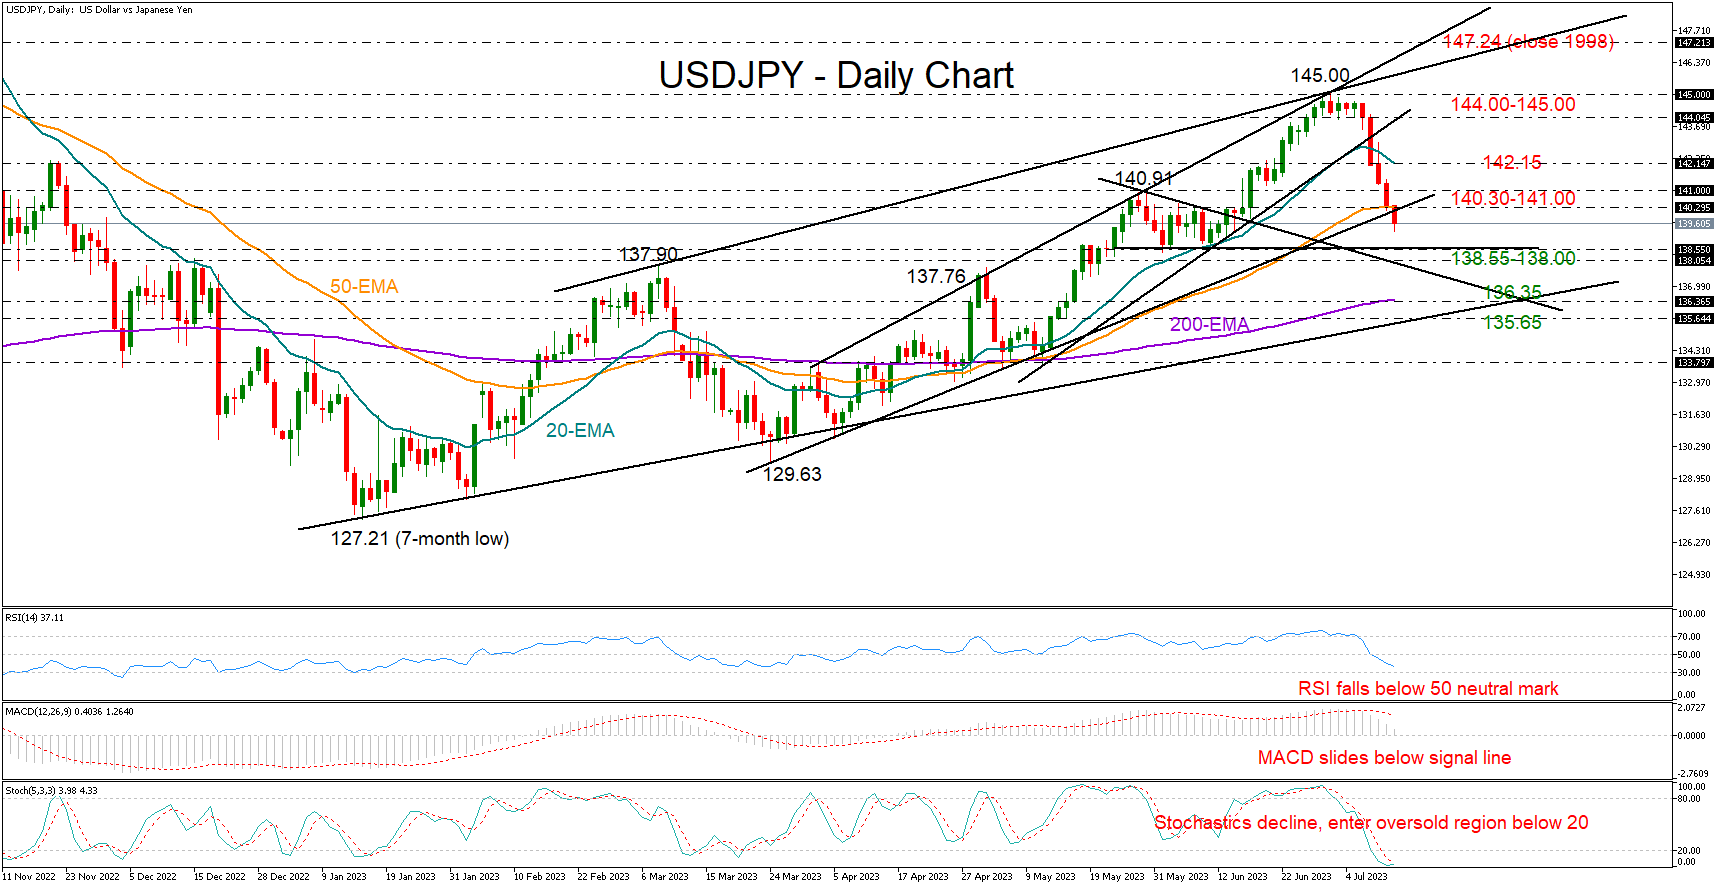
USD/JPY sellers could stay in play
USDJPY has been sold aggressively since the NFP release last Friday, falling by almost 2.0% to a one-month low of 139.30.
The bears snapped the latest bullish wave from mid-June, which peaked at 145.00, currently aiming for a close below the 50-day exponential moving average (EMA) and the support trendline from the March low at 140.30.
Given the negative trajectory in the momentum indicators, the freefall in the price is expected to gain another leg to enter the 138.55-138.00 constraining zone, where the price stabilized back in June. It’s worthy to note that the 20-period EMA in the weekly chart is flattening within the same boundaries. Hence, a decisive close lower, and more importantly below 137.50, could renew selling pressures, shifting the spotlight to the 200-day EMA at 136.35. A drop below the 2023 ascending trendline at 135.65 would then signal a trend deterioration in the long-term picture.
An upside reversal, however, could be underway as the stochastic oscillator seems to be looking for a pivot within the oversold region below 20. Should the bulls take control immediately, pushing the pair back above the 140.30-141.00 area, they may initially pause around the 20-day EMA at 142.15. Even higher, traders would like to see an advance above the 144.00-145.00 zone and beyond the two ascending lines in order to raise their buying orders.
In brief, USDJPY could remain downbeat in the coming sessions, with traders looking for support within the 138.55-138.00 region. A bounce above 140.30-141.00 could reduce downside risks.
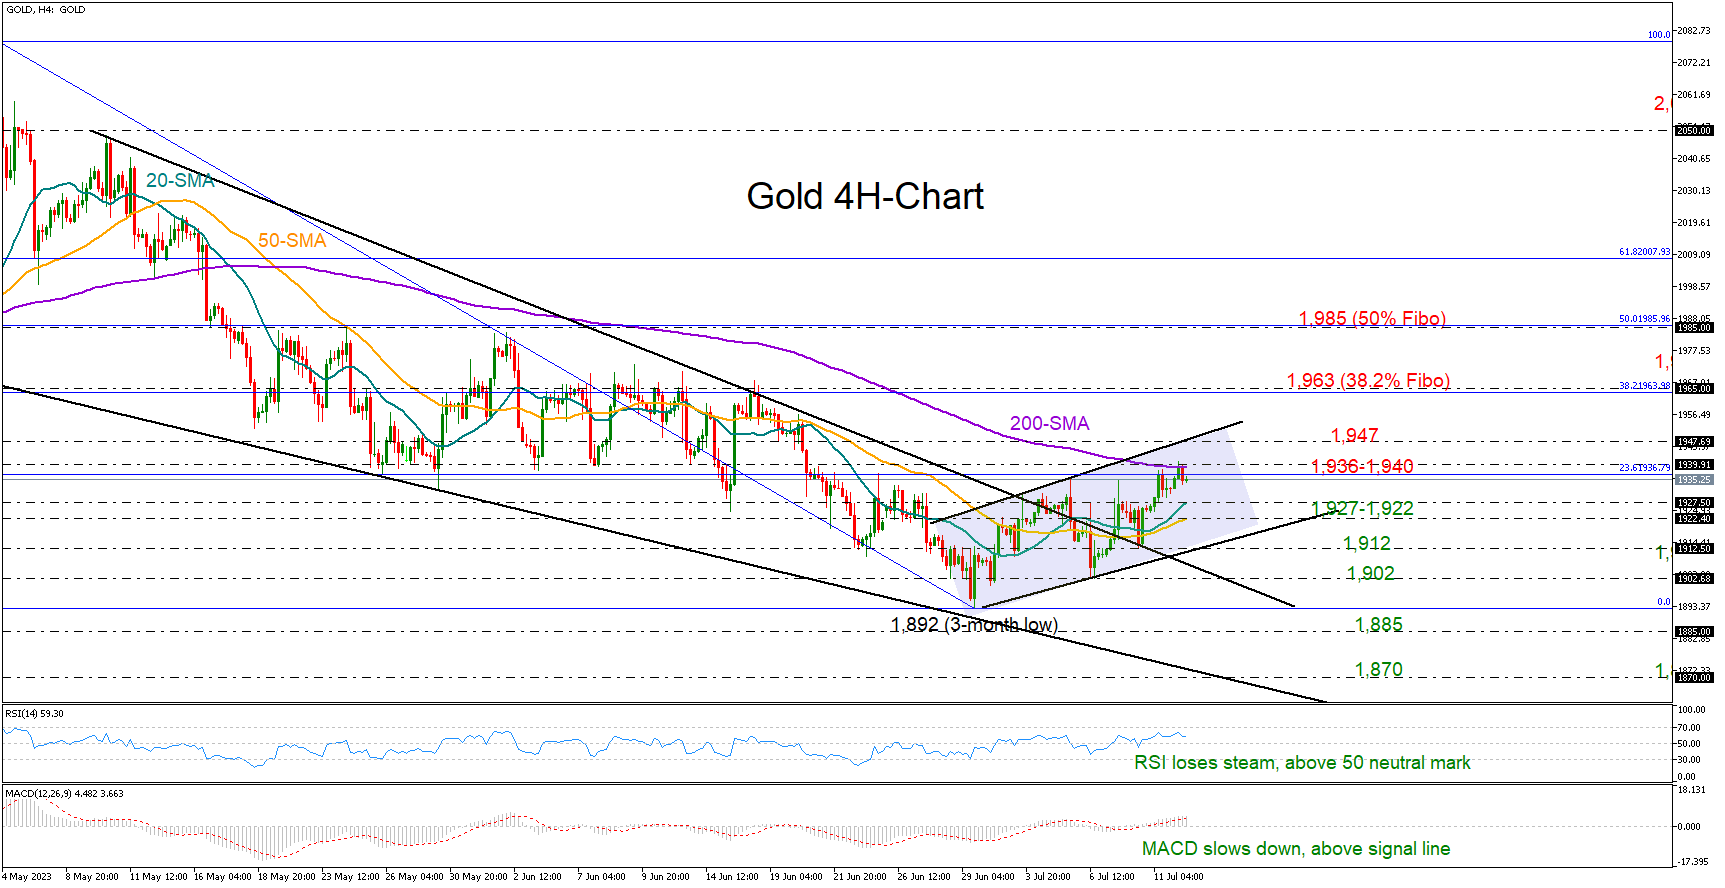
Gold trends higher, resistance within 1,940 area
Gold has been swinging higher in the four-hour chart since hitting a three-month low of 1,892 at the end of June, rising as high as 1,940 today.
The precious metal is hovering around a familiar constraining zone and near the 200-period simple moving average, which caused a soft decline over the past few hours. The 23.6% Fibonacci retracement of the previous downleg is cementing that wall as well. Hence, traders might wait for a clear close above the 1,936-1,940 boundary before they target the upper band of the short-term bullish channel at 1,947. A successful move higher could last till the 38.2% Fibonacci mark of 1,963, while a steeper rally could approach the 50% Fibonacci of 1,985.
From a technical perspective, the short-term bias is still positive, as the RSI and the MACD are comfortably above their neutral levels. However, some caution might be needed as the indicators seem to have lost some momentum.
A pullback below 1,936 could pause somewhere between the 20- and 50-period SMAs at 1,927 and 1,922 respectively. If sellers persist, the price may slide towards the channel’s lower band at 1,912. Even lower, the bears might pressure the 1,900-1,896 floor with scope to mark new lower lows, likely around the 1,870 handle if the 1,885 low from March 15 gives way.
Summing up, the short upward trend in gold may keep buying interest intact in the coming sessions. A continuation above 1,947 could boost market sentiment, whilst a slide below 1,912 could add more pressure on the market.
Author

Christina joined the XM investment research department in May 2017. She holds a master degree in Economics and Business from the Erasmus University Rotterdam with a specialization in International economics.


