S&P 500 technical analysis: Will the S&P 500 rebound continue?

Recommendation for S&P 500 Index: Buy
Buy Stop: Above 4190.67
Stop Loss ։ Below 4108.57
RSI։ Neutral
MACD։ Sell
Donchian Channel։ Buy
MA(200)։ Buy
Fractals։ Buy
Parabolic SAR։ Buy
Chart analysis
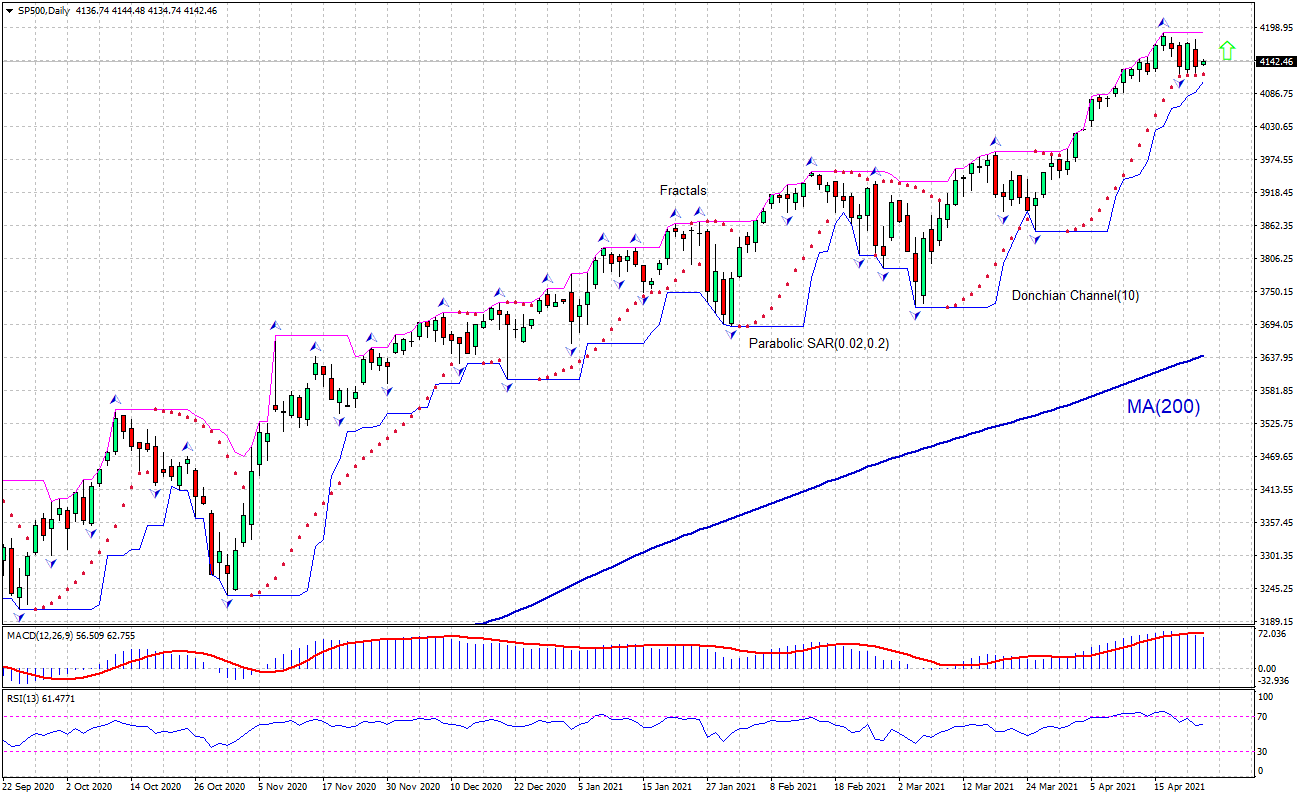
The technical analysis of the SP500 price chart in the daily timeframe shows SP500, Daily is retracing up after pulling back from all time high hit five days ago. It is above the 200-day moving average MA(200), which is rising. We believe the bullish momentum will continue after the price breaches above the upper boundary of Donchian channel at 4190.67. A level above this can be used as an entry point for placing a pending order to buy. The stop loss can be placed below 4108.57. After placing the order, the stop loss is to be moved every day to the next fractal low, following Parabolic signals. Thus, we are changing the expected profit/loss ratio to the breakeven point. If the price meets the stop loss level (4108.57) without reaching the order (4190.67), we recommend cancelling the order: the market has undergone internal changes which were not taken into account.
Fundamental analysis
US economic performance is improving according to recent week’s data. Will the SP500 rebound continue? US economic data in the last week were positive. March retail sales report surprised markets, factory activity in Philadelphia and New York states expanded in April, and labor market strengthening continued last week. Thus, Census Bureau reported US retail sales surged by 27.7% over year in March, when an increase of 7.9% was expected, the Philadelphia Fed Manufacturing Index rose to 50.2 in April of 2021 from a downwardly revised 44.5 in March and the New York Empire State Manufacturing Index rose to 26.3 in April of 2021 from 17.4 in March. Above 0 readings indicate improving conditions, below indicate worsening conditions. And Labor Department reported initial claims for state unemployment benefits decreased by 39,000 to a seasonally adjusted 547,000 for the week ended April 17, the lowest level since the Covid-19 pandemic began. Improving US economic data are bullish for SP500.
Want to get more free analytics? Open Demo Account now to get daily news and analytical materials.
Want to get more free analytics? Open Demo Account now to get daily news and analytical materials.
Author

Dmitry Lukashov
IFC Markets
Dimtry Lukashov is the senior analyst of IFC Markets. He started his professional career in the financial market as a trader interested in stocks and obligations.


