|

SP500 technical analysis : Will the SP500 retreat continue?

Recommendation for S&P 500 Index: Sell

Sell Stop : Below 3309.83

Stop Loss : Above 3447.19

IndicatorValueSignal
RSI Neutral
MACD Sell
Donchian Channel Sell
MA(200) Buy
Fractals Neutral
Parabolic SAR Sell

Chart Analysis

SP500

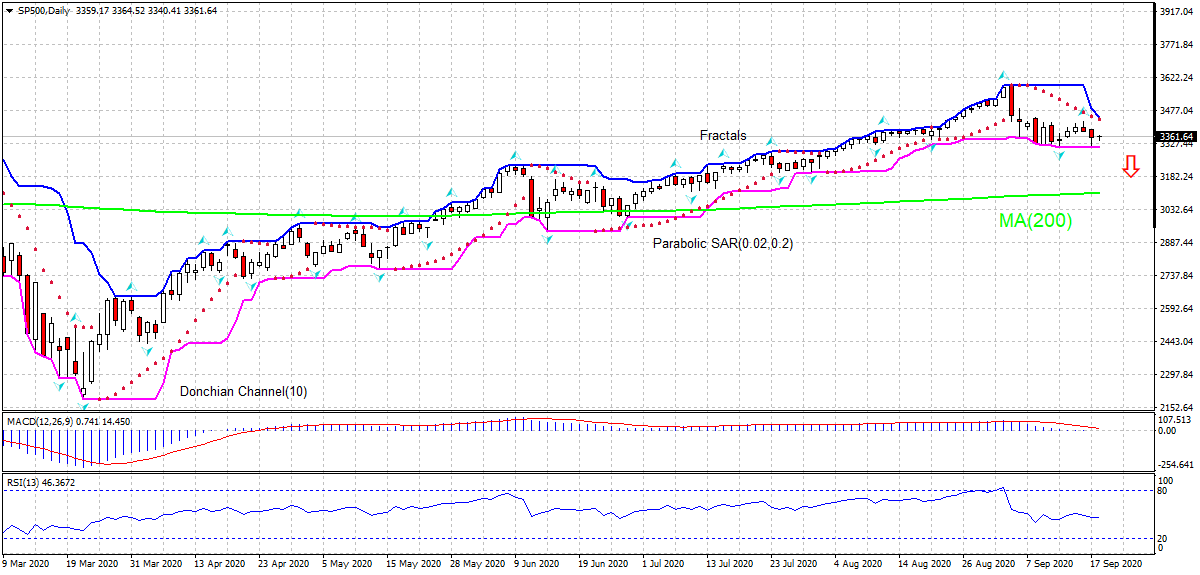
On the daily timeframe the SP500: Daily is retreating after hitting all time high in the beginning of September, while still above the 200-day moving average MA(200) which is rising yet. We believe the bearish momentum will continue after the price breaches below the lower boundary of Donchian channel at 3309.83. A level below this can be used as an entry point for placing a pending order to sell. The stop loss can be placed above 3447.19. After placing the order, the stop loss is to be moved every day to the next fractal high, following Parabolic signals. Thus, we are changing the expected profit/loss ratio to the breakeven point. If the price meets the stop loss level (3447.19) without reaching the order (3309.83), we recommend cancelling the order: the market has undergone internal changes which were not taken into account

Fundamental Analysis

US economic recovery slowed in September. Will the SP500 retreat continue?


Want to get more free analytics? Open Demo Account now to get daily news and analytical materials.


Want to get more free analytics? Open Demo Account now to get daily news and analytical materials.

Author

Dmitry  Lukashov

Dmitry Lukashov

IFC Markets

Dimtry Lukashov is the senior analyst of IFC Markets. He started his professional career in the financial market as a trader interested in stocks and obligations.

More from Dmitry Lukashov
Share:

Markets move fast. We move first.

Orange Juice Newsletter brings you expert driven insights - not headlines. Every day on your inbox.

By subscribing you agree to our Terms and conditions.

Editor's Picks

EUR/USD struggles for direction amid USD gains

EUR/USD is trimming part of its earlier gains, coming under some mild downside pressure near 1.1730 as the US Dollar edges higher. Markets are still digesting the Fed’s latest rate decision, while also looking ahead to more commentary from Fed officials in the sessions ahead.

GBP/USD drops to daily lows near 1.3360

Disappointing UK data weighed on the Sterling towards the end of the week, triggering a pullback in GBP/USD to fresh daily lows near 1.3360. Looking ahead, the next key event across the Channel is the BoE meeting on December 18.

Gold poised to challenge record highs

Gold prices added roughly 3% in the week, flirting with the $4,350 mark on Friday, to finally settle at around $4,330. Despite its safe-haven condition, the bright metal rallied in a risk-on scenario, amid broad US Dollar weakness.

Week ahead: US NFP and CPI, BoE, ECB and BoJ mark a busy week

After Fed decision, dollar traders lock gaze on NFP and CPI data. Will the BoE deliver a dovish interest rate cut? ECB expected to reiterate “good place” mantra. Will a BoJ rate hike help the yen recover some of its massive losses?

Big week ends with big doubts

The S&P 500 continued to push higher yesterday as the US 2-year yield wavered around the 3.50% mark following a Federal Reserve (Fed) rate cut earlier this week that was ultimately perceived as not that hawkish after all. The cut is especially boosting the non-tech pockets of the market.

Aave Price Forecast: AAVE primed for breakout as bullish signals strengthen

Aave (AAVE) price is trading above $204 at the time of writing on Friday and approaching the upper boundary of its descending parallel channel; a breakout from this structure would favor the bulls.