Technical analysis for EURUSD: 10th October -14th October

The overall movement of the EURUSD pair was confined in a narrow range in the last week. The pair experienced ranging movement with critical resistance at 1.12732 and potential support at 1.11395.In the daily chart, the price is chopping the 100 and 200 days daily SMA with the slightly bullish mode. Last week the Euro sharply bounced back from its initial support zone at 1.11395.The US economy added 156,000 jobs in the last month of September according to the last release of NFP data. The expected unemployment claim was 4.9% which came slightly worse, ticking up 5.0%.The average hourly earnings of the US people remained constant at 0.2% just as expected. This has created relief into the mind of investors of EURO helping the pair to rally up against its major rival in the month of October. Investors are expecting a bullish opening in the EURUSD pair since fundamentally the dollar has weakened to great extent followed by the interest rate hike decision. In the last FOMC meeting minute, the FED clearly announced that they are going to hold the interest rate hike decision till the month of December 2016.The dovish hold in the interest rate hike decision slipped the dollar down against all its major rivals. The most important economic event in the current week is the FOMC meeting minutes. If the FED comes up with a hawkish statement then we can again see a decent drop in the price of EURUSD pair. But things will get bullish if the FED still remains rigid about the delay of their current interest rate decision in the upcoming FOMC meeting minutes. So we can expect a strong bullish run in the EURUSD pair towards the 1.1400 level if the first critical resistance at 1.1250 level is taken in the daily chart. On the contrary, the EURO is not ready to weaken their currency furthermore followed by the Brexit news.
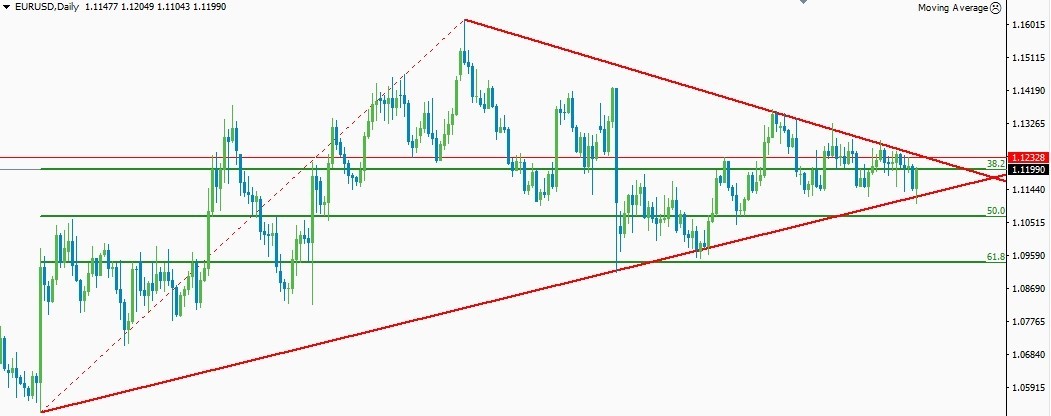
Figure: Technical parameter in the EURUSD pair
There has been a mass confusion into the mind of EURO traders from the very beginning of the month of September. The price has formed a nice ascending triangle like structure with initial low of 1.0520 levels and the peak is at 1.16000 level. The bullish Fibonacci level has also been drawn from the low of 3rd December 2015 to the high of 3rd may 2016.Currently, price is testing the critical resistance level at 1.1190 level where the 38.2% Fibonacci retracement level lines. Investors are cautiously waiting for the German Economic New statement since it might act as the driving catalyst to breach the triangle resistance level at 1.1250 levels. A daily closing above that level will bring strong upward rally in the pair targeting the major resistance level at 1.1400 levels. Professional traders will enter the long entry in the EURUSD pair if the pair manages to break the sloping bearish trend line of the ascending triangle chart pattern.
If the FED comes with a positive tone in the upcoming FOMC meeting minutes then we can see a strong bearish rally in the EURUSD pair in favor of the long-term bearish trend. The first initial bearish target of the pair would be 1.11256 levels. At this critical support level, the 50% Fibonacci retracement level also lies. A valid break of that level will bring the pair towards the 61.8% retracement level at 1.09448 levels. Those who are bullish on this pair can enter long against the long-term prevailing bearish trend at the 61.8% retracement level with price action confirmation signal. However, if this level fails to hold the support level then we will see a sharp fall in the EURUSD pair in favor of the bearish trend. This will lead to a retest of the low of 3rd December 2015.A decent bounce is expected from that level if the FED remains dovish about their interest rate hike decision at that time. A daily closing below the 1.05218 level will bring long term bearish momentum again into action with an initial bearish target of 1.0200 marks.
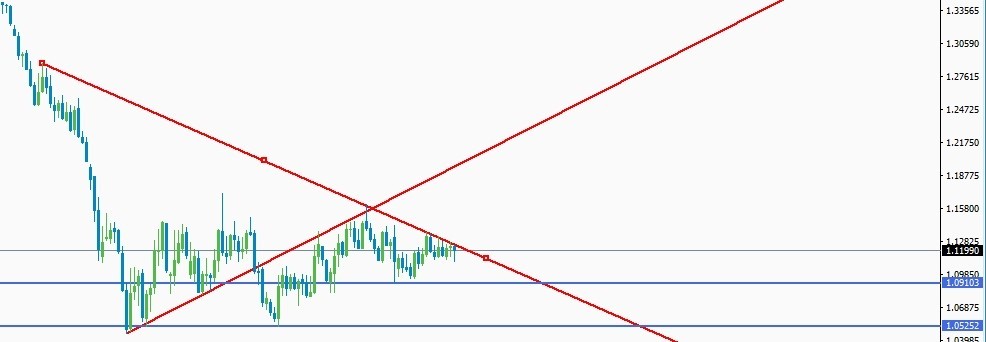
Figure: Weekly chart analysis for the EURUSD pair
The long term bearish trend in the weekly chart tends to complete its correction near the 1.1600 mark in the weekly chart. Currently, price is testing the bearish weekly trend line resistance level. If the price manages to breach the 1.1250 mark in the weekly chart then we can see a strong bullish rally in the EURUSD pair. The first initial bullish target for the pair would the high of 3rd may 2016.A clear bullish break above that level will bring the pair towards the 1.2500 level. Testing of that level will confirm the end of the long term bearish momentum of this pair and we can expect a fresh new bullish trend in the EURUSD pair. On the contrary, if the pair manages to hold the critical resistance level of 1.1250 then we will see a decent drop in price towards the 1.09103 level. A clear decisive break of that level will bring further downward momentum towards the 1.0500 level
Summary: The EURUSD pair has been trading higher for the last couple of months. The long-term trend traders are overly cautious about the current price action scenario of the EURUSD pair. The recent weakness of the US dollar followed by the dovish statement of the FED has created bullish trend reversal opportunity in the EURUSD pair. Considering all the facts the pair has more upside potential even though the price is trading near major resistance level. A valid break of that level confirms fresh buying momentum in the EURUSD pair.
Author

Dwayne Buzzell
Dwaynebuzzell.com
An economist, Forex trader and Forex writer. Dwayne has a keen eye for spotting international trading trends.


