Technical Analysis DJI - Will the Dow Jones Industrial Average continue falling?

| Indicator | Signal |
| RSI | Sell |
| Parabolic SAR | Sell |
| Bollinger Bands | Sell |
| MACD | Sell |
| MA(200) | Neutral |
Chart Analysis
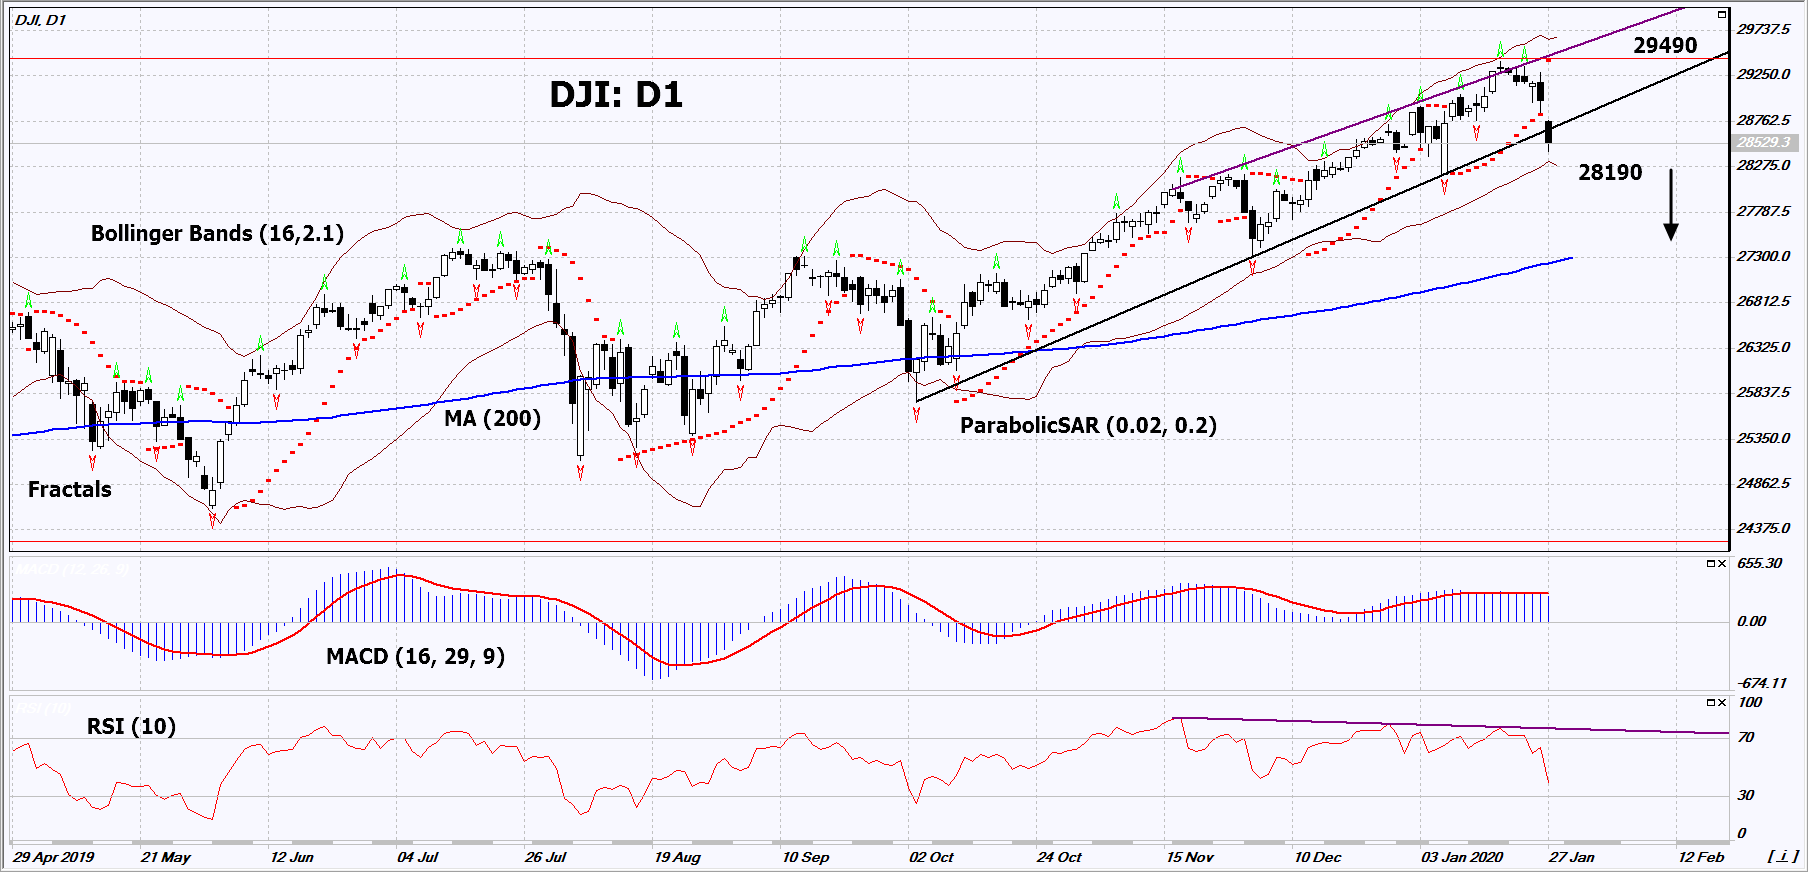
On the daily timeframe, the DJI: D1 breached down the short-term support line of the uptrend. A number of technical analysis indicators formed sell signals.
The bearish momentum may develop in case DJI falls below the two last fractal lows and the lower Bollinger band at 28190. This level may serve as an entry point. The initial stop loss may be placed above the last fractal high, the historical high and the Parabolic signal at 29490. After opening the pending order, we shall move the stop to the next fractal low following the Bollinger and Parabolic signals. Thus, we are changing the potential profit/loss to the breakeven point. More risk-averse traders may switch to the 4-hour chart after the trade and place there a stop-loss moving it in the direction of the trade. If the price meets the stop level (29490) without reaching the order (28190), we recommend closing the position: the market sustains internal changes that were not taken into account.
Fundamental Analysis
Investors fear that the further spread of the coronavirus outbreak in China will hurt the global economy. Will the Dow Jones Industrial Average continue falling?
Chinese government extended for 3 days the official weekend for Lunar New Year celebrations until February 2. A number of major Chinese corporations, including Alibaba Group Holding and Tencent Holdings, extended the weekend for a week for their staff. Quarantine measures to prevent the spread of the coronavirus outbreak are the purpose of these events. On Monday, the number of infected people in China increased by 30% compared with Friday and approached 3 thousand people. The number of officially dead - 81 people. US President Donald Trump said that the United States is ready to provide any assistance to China in the fight against the epidemic. After this, stock prices rose on Monday. From the fundamental point of view, it is still difficult to say whether the decrease in US stock indices will turn into a full correction. 141 companies from the S&P 500 list will present their reports this week in the US. The most significant ones may be the reports of Apple, Microsoft, Boeing, as well as Coca-Cola, Colgate-Palmolive, Chevron, Exxon Mobil, and other companies. In addition, a lot of significant economic statistics will be released this week, and the next Fed meeting will be held on January 29. All this will affect the dynamics of indices.
Want to get more free analytics? Open Demo Account now to get daily news and analytical materials.
Want to get more free analytics? Open Demo Account now to get daily news and analytical materials.
Author

Dmitry Lukashov
IFC Markets
Dimtry Lukashov is the senior analyst of IFC Markets. He started his professional career in the financial market as a trader interested in stocks and obligations.


