Technical Analysis &BRENT/WTI : 2019-04-22

WTI prices may fall because of shale oil
In this review, we suggest considering the personal composite instrument (PCI) “Brent vs WTI”. Is there a possibility for BRENT/WTI prices to rise?
Such a movement is observed when Brent oil is in higher demand than WTI. Theoretically, an increase in the share of shale oil in American production may have a negative impact on the cost of West Texas Intermediate (WTI). Shale oil production in the US increased from 1 million barrels per day in 2008 to the current level of about 7-7.5 million barrels per day. Its share in the total US oil production has reached 60%. In 2008, WTI and Brent had nearly the same cost. Now Brent is only 8-10% more expensive. US President Donald Trump has repeatedly called for the Organization of the Petroleum Exporting Countries (OPEC) with an offer to increase the production and reduce world oil prices. If he takes any measures to reduce American oil prices for US consumers, this may become another factor for the BRENT/WTI growth.
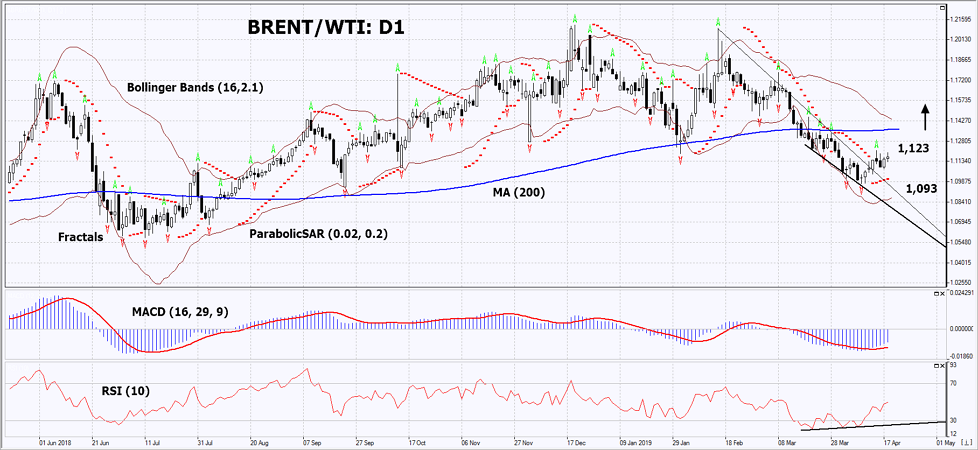
On the daily timeframe, BRENT/WTI: D1 has left the downtrend and is correcting upward. The further price increase is possible in case of the deterioration of WTI or any measures by the US government to support its customers.
- The Parabolic Indicator gives a bullish signal.
- The Bollinger bands have widened, which indicates high volatility. The lower Bollinger band is titled upward.
- The RSI indicator is near 50. It has formed a positive divergence.
- The MACD indicator gives a bullish signal.
The bullish momentum may develop in case BRENT/WTI exceeds its last fractal high at 1.123. This level may serve as an entry point. The initial stop loss may be placed below the last fractal low and the Parabolic signal at 1.093. After opening the pending order, we shall move the stop to the next fractal low following the Bollinger and Parabolic signals. Thus, we are changing the potential profit/loss to the breakeven point. More risk-averse traders may switch to the 4-hour chart after the trade and place there a stop loss moving it in the direction of the trade. If the price meets the stop level (1.093) without reaching the order (1.123), we recommend to close the position: the market sustains internal changes that were not taken into account.
Summary of technical analysis
| Position | Buy |
| Buy stop | Above 1.123 |
| Stop loss | Below 1.093 |
Want to get more free analytics? Open Demo Account now to get daily news and analytical materials.
Author

Dmitry Lukashov
IFC Markets
Dimtry Lukashov is the senior analyst of IFC Markets. He started his professional career in the financial market as a trader interested in stocks and obligations.


