TASI Index Elliott Wave technical analysis [Video]
![TASI Index Elliott Wave technical analysis [Video]](https://editorial.fxstreet.com/images/Markets/Equities/curved-stock-exchange-ticker-numbers-and-arrows-on-black-58549212_XtraLarge.jpg)
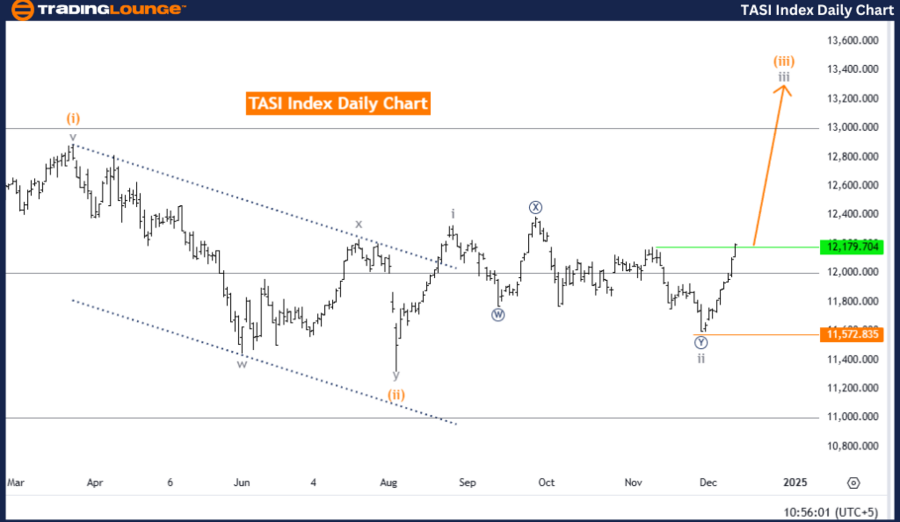
TASI Index Elliott Wave Analysis - Trading Lounge Day Chart.
TASI Index Elliott Wave technical analysis
-
Function: Bullish Trend.
-
Mode: Impulsive.
-
Structure: Gray Wave 3.
-
Position: Orange Wave 3.
-
Direction (next higher degrees): Gray Wave 3 (initiated).
-
Details: Gray Wave 2 appears complete, and Gray Wave 3 is currently progressing.
-
Wave invalid level: 11,572.835.
The TASI Index daily chart presents an Elliott Wave analysis that confirms a bullish trend. The wave structure is classified as Gray Wave 3 within an impulsive mode, with Orange Wave 3 actively developing. This suggests continued upward momentum, consistent with the broader bullish outlook.
Key insights
-
Completion of Gray Wave 2: The analysis indicates that Gray Wave 2 has been completed, signaling the start of Gray Wave 3.
-
Impulsive Waves Drive Momentum: According to Elliott Wave Theory, impulsive waves indicate strong directional trends. The progression of Gray Wave 3 highlights a sustained bullish phase with potential for additional gains.
-
Invalidation Level at 11,572.835: If the market drops below this level, the current wave structure will be invalidated, requiring a reassessment of the bullish scenario.
This analysis provides a detailed understanding of the ongoing bullish trend in the TASI Index. The shift from Gray Wave 2 to the active development of Gray Wave 3 emphasizes robust upward momentum. Traders and investors can use this information to anticipate further gains and adjust their strategies accordingly.
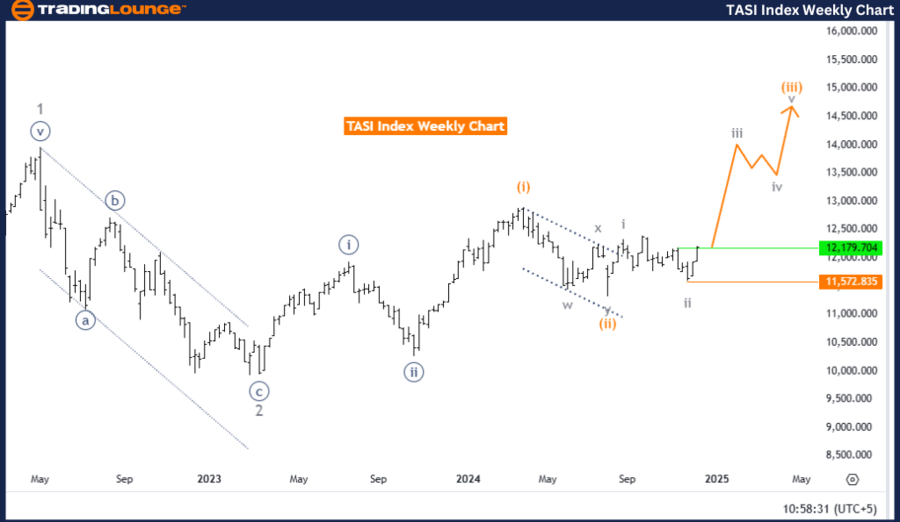
TASI Index Elliott Wave Analysis - Trading Lounge weekly chart
TASI Index Elliott Wave technical analysis
-
Function: Bullish Trend.
-
Mode: Impulsive.
-
Structure: Gray Wave 3.
-
Position: Orange Wave 3.
-
Direction (next higher degrees): Gray Wave 3 (initiated).
-
Details: Gray Wave 2 has been completed, and Gray Wave 3 is actively progressing.
-
Wave Invalid Level: 11,572.835.
The TASI Index weekly chart highlights a bullish trend as interpreted through the Elliott Wave framework. The wave structure is categorized as Gray Wave 3 within an impulsive mode, with Orange Wave 3 actively unfolding. This reflects a strong upward movement consistent with the broader bullish momentum.
Key insights
-
Completion of Gray Wave 2: The analysis confirms that Gray Wave 2 has concluded, allowing the market to advance into Gray Wave 3.
-
Impulsive Wave Strength: In Elliott Wave Theory, impulsive waves represent dominant market trends. The ongoing development of Gray Wave 3 underscores sustained growth and potential for further gains.
-
Invalidation Level at 11,572.835: A decline below this level would negate the current wave structure, requiring a reassessment of the bullish scenario.
This analysis underscores the strong upward trend in the TASI Index. The shift from the corrective phase of Gray Wave 2 to the impulsive phase of Gray Wave 3 demonstrates robust bullish momentum. Market participants can leverage this structured analysis to anticipate continued growth and make informed decisions aligned with the prevailing trend.
TASI Index Elliott Wave technical analysis [Video]
Author

Peter Mathers
TradingLounge
Peter Mathers started actively trading in 1982. He began his career at Hoei and Shoin, a Japanese futures trading company.


