Good Morning Traders,

As of this writing 4 AM EST, here’s what we see:

US Dollar: Sept. USD is Down at 94.715.
Energies: Jul '18 Crude is Up at 65.47.
Financials: The Sept 30 year bond is Down 2 ticks and trading at 144.01.
Indices: The Sept S&P 500 emini ES contract is 30 ticks Higher and trading at 2773.75.
Gold: The Aug gold contract is trading Down at 1276.00. Gold is 26 ticks Lower than its close.

Initial Conclusion

This is not a correlated market. The dollar is Down- and Crude is Up+ which is normal and the 30 year Bond is trading Lower. The Financials should always correlate with the US dollar such that if the dollar is lower then bonds should follow and vice-versa. The S&P is Higher and Crude is trading Higher which is not correlated. Gold is trading Down-  which is not correlated with the US dollar trading Down-. I tend to believe that Gold has an inverse relationship with the US Dollar as when the US Dollar is down, Gold tends to rise in value and vice-versa. Think of it as a seesaw, when one is up the other should be down. I point this out to you to make you aware that when we don't have a correlated market, it means something is wrong. As traders you need to be aware of this and proceed with your eyes wide open.

At this hour all of Asia is trading Higher and currently Europe is trading Higher as well.

Possible Challenges To Traders Today

  • Current Account is out at 8:30 AM EST. This is major.

  • Fed Chair Powell Speaks at 9:30 AM EST. This is major.

  • Existing Home Sales is out at 10 AM EST. This is major.

  • Crude Oil Inventories is out at 10:30 AM EST. This is major.
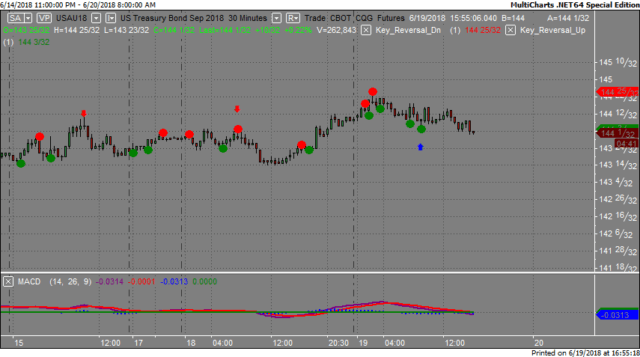
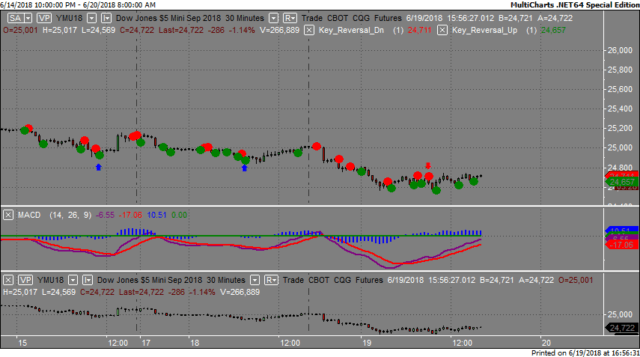
Treasuries

We've elected to switch gears a bit and show correlation between the 30 year bond (ZB) and The YM futures contract. The YM contract is the DJIA and the purpose is to show reverse correlation between the two instruments. Remember it's liken to a seesaw, when up goes up the other should go down and vice versa.

Yesterday the ZB made it's move at around 9 AM EST. The ZB hit a Low at around that time and the YM hit a High. If you look at the charts below ZB gave a signal at around 9 AM EST and the YM was moving Lower at the same time. Look at the charts below and you'll see a pattern for both assets. ZB hit a Low at around 9 AM and the YM was moving Lower at the same time. These charts represent the newest version of MultiCharts and I've changed the timeframe to a 30 minute chart to display better. This represented a long opportunity on the 30 year bond, as a trader you could have netted about a dozen ticks per contract on this trade. Each tick is worth $31.25.

Charts Courtesy of MultiCharts built on an AMP platform

Pre-Market Global Review

Pre-Market Global Review

Bias

Yesterday we gave the markets a Downside bias as the USD, the Bonds and Gold were all trading higher and this usually represents a downside day. The markets didn't disappoint as the Dow dropped 287 points and the other indices lost ground as well. Today we aren't dealing with a correlated market and our bias is to the Upside.

Could this change? Of Course. Remember anything can happen in a volatile market.

Commentary

Yesterday it was announced that President Trump approved additional tariffs on China amounting to another 200 billion dollars. The markets did not greet very well with the Dow falling by triple digits. Today we have Existing Home Sales and the Fed Chair speaking, both of which are major and proven market movers. So time will tell...

Trading performance displayed herein is hypothetical. The following Commodity Futures Trading Commission (CFTC) disclaimer should be noted.

Hypothetical performance results have many inherent limitations, some of which are described below. No representation is being made that any account will or is likely to achieve profits or losses similar to those shown.

In fact, there are frequently sharp differences between hypothetical performance results and the actual results subsequently achieved by any particular trading program. One of the limitations of hypothetical performance trading results is that they are generally prepared with the benefit of hindsight.

In addition, hypothetical trading does not involve financial risk, and no hypothetical trading record can completely account for the impact of financial risk in actual trading. For example, the ability to withstand losses or to adhere to a particular trading program in spite of trading losses are material points which can also adversely affect actual trading results.

There are numerous other factors related to the markets in general or to the implementation of any specific trading program which cannot be fully accounted for in the preparation of hypothetical performance results and all of which can adversely affect actual trading results.

Trading in the commodities markets involves substantial risk and YOU CAN LOSE A LOT OF MONEY, and thus is not appropriate for everyone. You should carefully consider your financial condition before trading in these markets, and only risk capital should be used.

In addition, these markets are often liquid, making it difficult to execute orders at desired prices. Also, during periods of extreme volatility, trading in these markets may be halted due to so-called “circuit breakers” put in place by the CME to alleviate such volatility. In the event of a trading halt, it may be difficult or impossible to exit a losing position.

Recommended Content


Recommended Content

Editors’ Picks

AUD/USD: The hunt for the 0.7000 hurdle

AUD/USD: The hunt for the 0.7000 hurdle

AUD/USD quickly left behind Wednesday’s strong pullback and rose markedly past the 0.6900 barrier on Thursday, boosted by news of fresh stimulus in China as well as renewed weakness in the US Dollar.

AUD/USD News
EUR/USD refocuses its attention to 1.1200 and above

EUR/USD refocuses its attention to 1.1200 and above

Rising appetite for the risk-associated assets, the offered stance in the Greenback and Chinese stimulus all contributed to the resurgence of the upside momentum in EUR/USD, which managed to retest the 1.1190 zone on Thursday.

EUR/USD News
Gold holding at higher ground at around $2,670

Gold holding at higher ground at around $2,670

Gold breaks to new high of $2,673 on Thursday. Falling interest rates globally, intensifying geopolitical conflicts and heightened Fed easing bets are the main factors. 

Gold News
Bitcoin displays bullish signals amid supportive macroeconomic developments and growing institutional demand

Bitcoin displays bullish signals amid supportive macroeconomic developments and growing institutional demand

Bitcoin (BTC) trades slightly up, around $64,000 on Thursday, following a rejection from the upper consolidation level of $64,700 the previous day. BTC’s price has been consolidating between $62,000 and $64,700 for the past week.

Read more
RBA widely expected to keep key interest rate unchanged amid persisting price pressures

RBA widely expected to keep key interest rate unchanged amid persisting price pressures

The Reserve Bank of Australia is likely to continue bucking the trend adopted by major central banks of the dovish policy pivot, opting to maintain the policy for the seventh consecutive meeting on Tuesday.

Read more
Five best Forex brokers in 2024

Five best Forex brokers in 2024

VERIFIED Choosing the best Forex broker in 2024 requires careful consideration of certain essential factors. With the wide array of options available, it is crucial to find a broker that aligns with your trading style, experience level, and financial goals. 

Read More

Majors

Cryptocurrencies

Signatures