Tariffs served to drive the markets lower

USD: Jun '25 is Up at 104.135.
Energies: May '25 Crude is Down at 69.73.
Financials: The Jun '25 30 Year T-Bond is Higher by 21 ticks and trading at 116.10.
Indices: The Jun '25 S&P 500 emini ES contract is 32 ticks Lower and trading at 5733.00.
Gold: The Jun'25 Gold contract is trading Up at 3114.00.
Initial conclusion
This is not a correlated market. The USD is Up and Crude is Down which is normal, and the 30 Year T-Bond is trading Higher. The Financials should always correlate with the US dollar such that if the dollar is Higher, then the bonds should follow and vice-versa. The S&P is Lower and Crude is trading Down which is not correlated. Gold is trading Higher which is not correlated with the US dollar trading Up. I tend to believe that Gold has an inverse relationship with the US Dollar as when the US Dollar is down, Gold tends to rise in value and vice-versa. Think of it as a seesaw, when one is up the other should be down. I point this out to you to make you aware that when we don't have a correlated market, it means something is wrong. As traders you need to be aware of this and proceed with your eyes wide open. All of Asia traded Higher except the Aussie and the Nikkei exchanges. All of Europe is trading Lower with the exception of the London exchange which is Higher.
Possible challenges to traders
-
Core PCE Price Index m/m is out at 8:30 AM EST. This is Major.
-
Personal Income m/m is out at 8:30 AM EST. This is Major.
-
Personal Spending m/m is out at 8:30 AM EST. This is Major.
-
Revised UOM Consumer Sentiment is out at 10 AM EST. This is not Major.
-
Revised UOM Inflation Expectations is out at 10 AM EST. This is not Major.
-
FOMC Member Barr Speaks at 12:15 PM EST. This is Major.
-
FOMC Member Bostic Speaks at 3:45 PM EST. This is Major.
Traders, please note that we've changed the Bond instrument from the 10 Year (ZN) to the 2 Year (ZT). They work exactly the same.
We've elected to switch gears a bit and show correlation between the 2-year Treasury notes (ZT) and the S&P futures contract. The YM contract is the Dow Jones Industrial Average, and the purpose is to show reverse correlation between the two instruments. Remember it's likened to a seesaw, when up goes up the other should go down and vice versa.
Yesterday the ZT veered Higher at around 8:30 AM EST with Unemployment Claims pending at that time. The Dow moved Lower at the same time. Look at the charts below and you'll see a pattern for both assets. The Dow moved Lower at 8:30 AM EST and the ZT moved Higher at around the same time. These charts represent the newest version of Bar Charts, and I've changed the timeframe to a 15-minute chart to display better. This represented a Long opportunity on the 2-year note, as a trader you could have netted about 20 plus ticks per contract on this trade. Each tick is worth $6.25. Please note: the front month for ZT is now Jun '25 and the Dow is Jun '25 as well. I've changed the format to filled Candlesticks (not hollow) such that it may be more apparent and visible.
Charts courtesy of barcharts
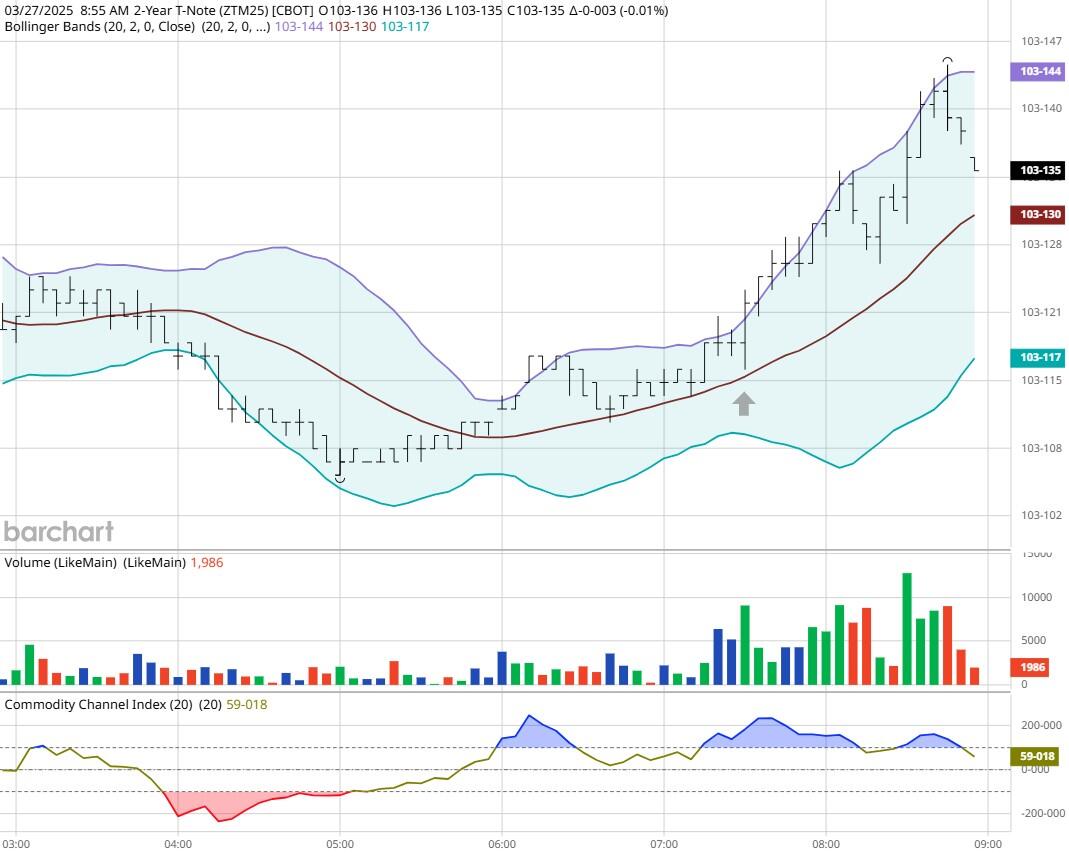
ZT -Jun 2025 - 3/27/25
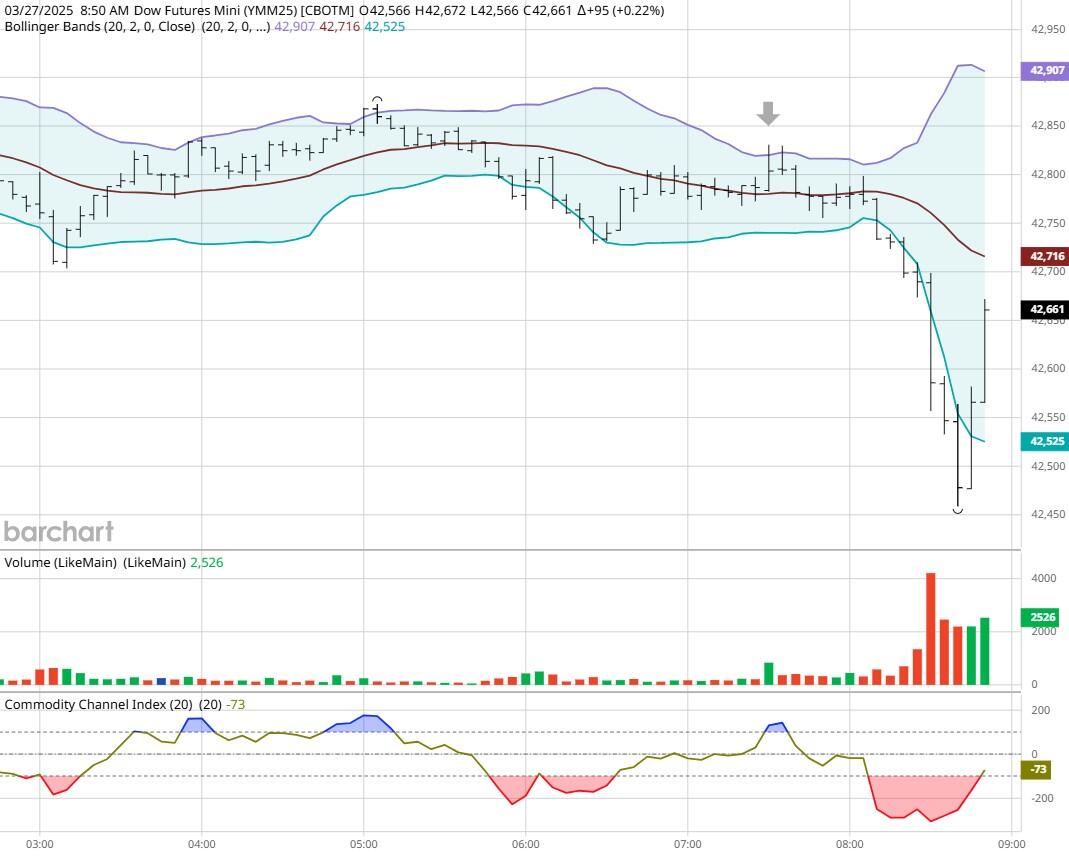
Dow - Mar 2025- 3/27/25
Bias
Yesterday we gave the markets an Upside bias as the indices were correlated in that direction Thursday morning. However continuing news regarding the upcoming tariffs served to drive the markets Lower, especially when it's reported that prices for a new foreign made car might exceed 25%. Even those vehicles assembled in the USA won't escape completely unscathed as the foreign made parts that would go into making a completed vehicle will be taxed. So, either way prices will go up which didn't sit well with the markets as they all retreated. The Dow dropped 155 points as did the other indices. All finished Lower. Today we aren't dealing with a correlated market, and our bias is to the Downside.
Could this change? Of Course. Remember anything can happen in a volatile market.
Commentary
As stated above, the markets didn't quite like the news that prices for autos will increase. Mind you autos are the second highest expenditure after housing.
Author

Nick Mastrandrea
Market Tea Leaves


