Tariff threats torpedo markets

USD: Mar '25 is Up at 106.465.
Energies: Apr '25 Crude is Down at 68.86.
Financials: The Mar '25 30 Year T-Bond is Lower by 7 ticks and trading at 117.14.
Indices: The Mar '25 S&P 500 emini ES contract is 104 ticks Higher and trading at 5995.50.
Gold: The Feb'25 Gold contract is trading Up at 2927.60.
Initial conclusion
This is not a correlated market. The USD is Up and Crude is Down which is normal, but the 30 Year T-Bond is trading Lower. The Financials should always correlate with the US dollar such that if the dollar is Higher, then the bonds should follow and vice-versa. The S&P is Higher and Crude is trading Lower which is correlated. Gold is trading Higher which is not correlated with the US dollar trading Up. I tend to believe that Gold has an inverse relationship with the US Dollar as when the US Dollar is down, Gold tends to rise in value and vice-versa. Think of it as a seesaw, when one is up the other should be down. I point this out to you to make you aware that when we don't have a correlated market, it means something is wrong. As traders you need to be aware of this and proceed with your eyes wide open. Asia traded Higher with the exception of the Nikkei and Singapore exchanges. All of Europe is trading Higher.
Possible challenges to traders
-
FOMC Member Barkin Speaks at 8:30 AM EST. This is Major.
-
New Home Sales is out at 10 AM EST. This is Major.
-
Crude Oil Inventories is out at 10:30 AM EST. This is Major.
-
FOMC Member Bostic Speaks at 12 noon EST. This is Major.
Traders, please note that we've changed the Bond instrument from the 10 year (ZN) to the 2 year (ZT). They work exactly the same.
We've elected to switch gears a bit and show correlation between the 2-year Treasury notes (ZT) and the S&P futures contract. The YM contract is the Dow Jones Industrial Average, and the purpose is to show reverse correlation between the two instruments. Remember it's likened to a seesaw, when up goes up the other should go down and vice versa.
Yesterday the ZT Migrated Lower at around 7:30 AM EST with no economic news in sight. The Dow moved Higher at the same time. Look at the charts below and you'll see a pattern for both assets. The Dow moved Higher at 7:30 AM EST and the ZT moved Lower at around the same time. These charts represent the newest version of Bar Charts, and I've changed the timeframe to a 15-minute chart to display better. This represented a Short opportunity on the 2-year note, as a trader you could have netted about a dozen ticks per contract on this trade. Each tick is worth $7.625. Please note: the front month for ZT is now Mar '25 and the Dow is now Mar '25. I've changed the format to filled Candlesticks (not hollow) such that it may be more apparent and visible.
Charts courtesy of BarCharts
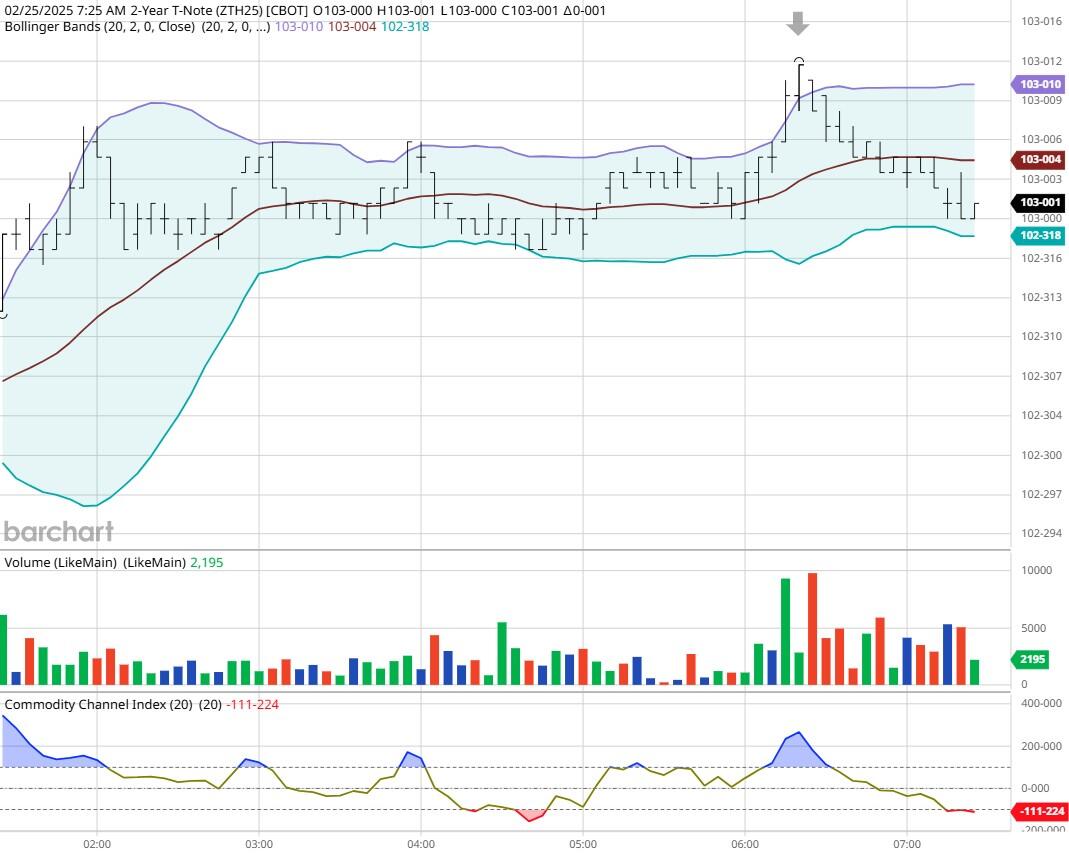
ZT -Mar 2025 - 2/25/25
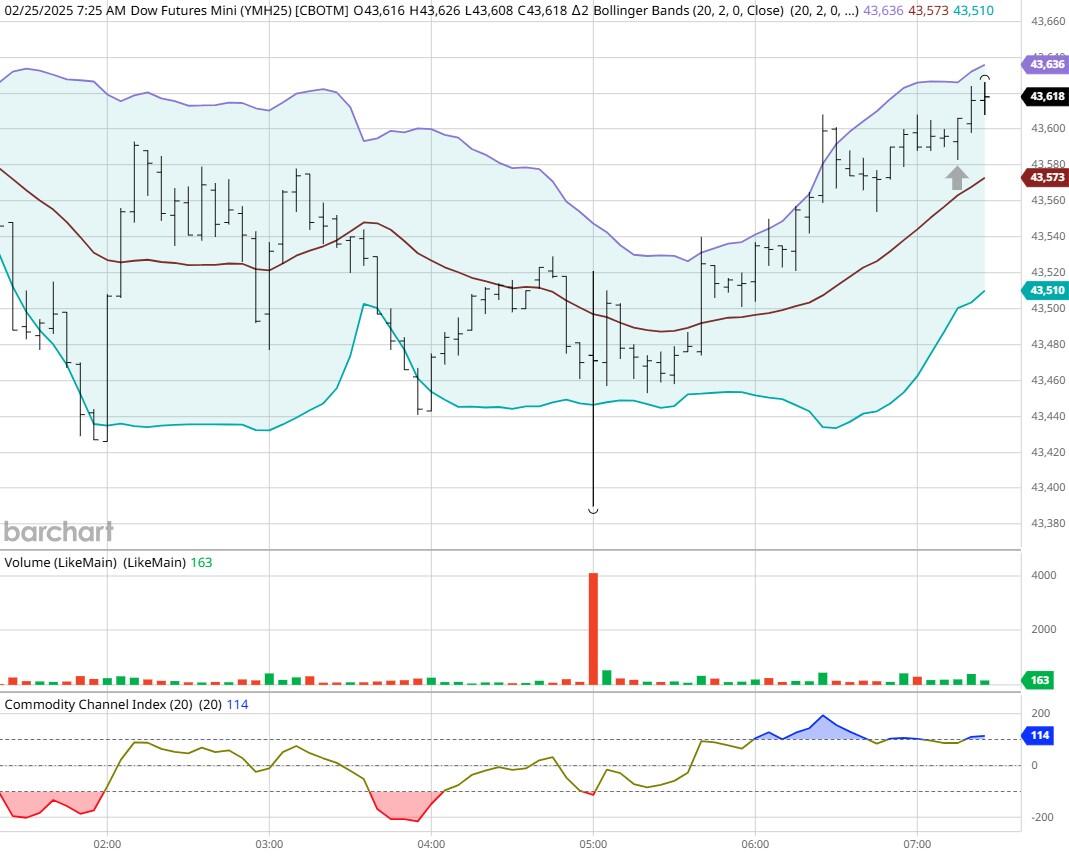
Dow - Mar 2025- 2/25/25
Bias
Yesterday we gave the markets an Upside bias as the USD, Crude and Gold were all trading Lower Tuesday morning and that's usually indicative of an Upside market. We were partially correct as the Dow gained 160 points but the other traded Lower on the day. Today we aren't dealing with a correlated market, and our bias is to the Upside.
Could this change? Of Course. Remember anything can happen in a volatile market.
Commentary
So, it seems President Trump is serious about the tariffs mentioned earlier this month. This will not help with inflation or giving us a stable market. He will do this as he has no guardrails or anyone to stop him. He'll probably complain about interest rates being too high and may badger Fed Chair Powell to reduce rates, but the Fed Chair will answer to his own tune. Want to learn Market Correlation and determine market direction hours before the Opening Bell?
Author

Nick Mastrandrea
Market Tea Leaves


