![]() Nick Mastrandrea
Nick Mastrandrea
Market Tea Leaves
USD: Mar '25 is Up at 107.315.
Energies: Apr '25 Crude is Down at 69.48.
Financials: The Mar '25 30 Year T-Bond is Higher by 11 ticks and trading at 117.17.
Indices: The Mar '25 S&P 500 emini ES contract is 81 ticks Higher and trading at 5996.25.
Gold: The Feb'25 Gold contract is trading Down at 2872.60.
Initial conclusion
This is not a correlated market. The USD is Up and Crude is Down which is normal, and the 30 Year T-Bond is trading Higher. The Financials should always correlate with the US dollar such that if the dollar is Higher, then the bonds should follow and vice-versa. The S&P is Higher and Crude is trading Lower which is correlated. Gold is trading Lower which is correlated with the US dollar trading Up. I tend to believe that Gold has an inverse relationship with the US Dollar as when the US Dollar is down, Gold tends to rise in value and vice-versa. Think of it as a seesaw, when one is up the other should be down. I point this out to you to make you aware that when we don't have a correlated market, it means something is wrong. As traders you need to be aware of this and proceed with your eyes wide open. Asia traded Higher with the exception of the Aussie and Hang Seng exchanges. All of Europe is trading Lower with the exception of the London exchange.
Possible challenges to traders
-
Core PCE Price Index m/m is out at 8:30 AM EST. This is Major.
-
Goods Trade Balance is out at 8:30 AM EST. This is Major.
-
Personal Income m/m is out at 8:30 AM EST. This is Major.
-
Personal Spending m/m is out at 8:30 EST. This is Major.
-
Prelim Wholesale Inventories m/m is out at 8:30 AM EST. This is Major.
-
Chicago PMI is out at 9:45 AM EST. This is Major.
-
FOMC Member Goolsbee Speaks at 10:45 AM EST. This is Major.
Traders, please note that we've changed the Bond instrument from the 10 year (ZN) to the 2 year (ZT). They work exactly the same.
We've elected to switch gears a bit and show correlation between the 2-year Treasury notes (ZT) and the S&P futures contract. The YM contract is the Dow Jones Industrial Average, and the purpose is to show reverse correlation between the two instruments. Remember it's likened to a seesaw, when up goes up the other should go down and vice versa.
Yesterday the ZT Migrated Higher at around 8:30 AM EST as the Unemployment Claims were reported. The Dow moved Lower at the same time. Look at the charts below and you'll see a pattern for both assets. The Dow moved Lower at 8 AM EST and the ZT moved Higher at around the same time. These charts represent the newest version of Bar Charts, and I've changed the timeframe to a 15-minute chart to display better. This represented a Long opportunity on the 2-year note, as a trader you could have netted about a dozen plus ticks per contract on this trade. Each tick is worth $7.625. Please note: the front month for ZT is now Jun '25 and the Dow is still Mar '25. I've changed the format to filled Candlesticks (not hollow) such that it may be more apparent and visible.
Charts courtesy of barcharts

ZT -Jun 2025 - 2/27/25
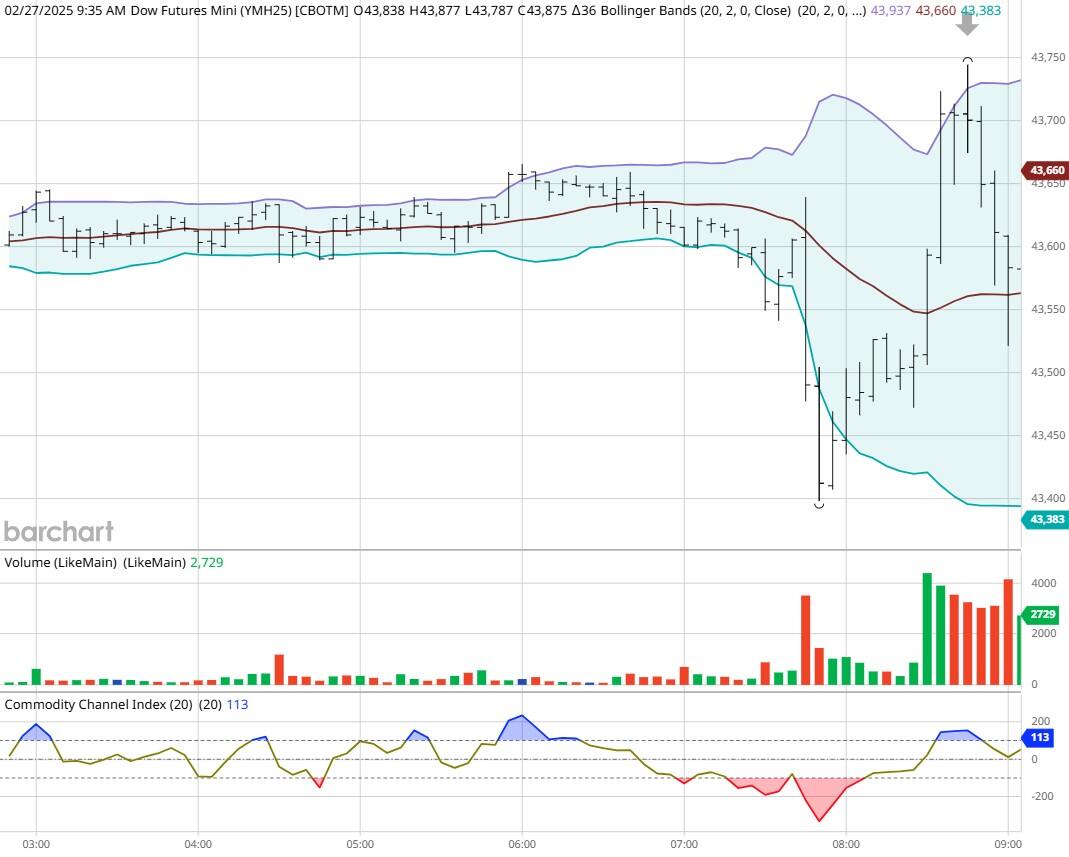
Dow - Mar 2025- 2/27/25
Bias
Yesterday we gave the markets an Upside bias as the Bonds and Gold were trading Lower Thursday AM and that usually represents an Upside bias. All indices fell on Thursday. The Dow dropped 194 points, and the other indices lost ground as well. Today we aren't dealing with a correlated market, and our bias is Neutral or Mixed.
Could this change? Of Course. Remember anything can happen in a volatile market.
Commentary
So, yesterday with continued talks of tariffs and layoffs for government workers the markets dropped with all the indices trading in negative territory. Today we should get some news on Ukraine as their president will be visiting. Will this be enough to propel the markets forward? As in all things, only time will tell.
Trading performance displayed herein is hypothetical. The following Commodity Futures Trading Commission (CFTC) disclaimer should be noted.
Hypothetical performance results have many inherent limitations, some of which are described below. No representation is being made that any account will or is likely to achieve profits or losses similar to those shown.
In fact, there are frequently sharp differences between hypothetical performance results and the actual results subsequently achieved by any particular trading program. One of the limitations of hypothetical performance trading results is that they are generally prepared with the benefit of hindsight.
In addition, hypothetical trading does not involve financial risk, and no hypothetical trading record can completely account for the impact of financial risk in actual trading. For example, the ability to withstand losses or to adhere to a particular trading program in spite of trading losses are material points which can also adversely affect actual trading results.
There are numerous other factors related to the markets in general or to the implementation of any specific trading program which cannot be fully accounted for in the preparation of hypothetical performance results and all of which can adversely affect actual trading results.
Trading in the commodities markets involves substantial risk and YOU CAN LOSE A LOT OF MONEY, and thus is not appropriate for everyone. You should carefully consider your financial condition before trading in these markets, and only risk capital should be used.
In addition, these markets are often liquid, making it difficult to execute orders at desired prices. Also, during periods of extreme volatility, trading in these markets may be halted due to so-called “circuit breakers” put in place by the CME to alleviate such volatility. In the event of a trading halt, it may be difficult or impossible to exit a losing position.
Recommended Content
Editors’ Picks

Gold races toward $3,150, at record highs amid tariff woes
Gold price stretches its record-setting rally toward $3,150 in European trading on Monday. The bullion continues to capitalize on safe-haven flows amid intesifying global tariff war fears. US economic concerns weigh on the US Dollar and Treasury yields, aiding the Gold price upsurge.

EUR/USD holds steady below 1.0850 ahead of German inflation data
EUR/USD is holding steady below 1.0850 in early Europe on Monday. The pair draws some support from a broadly weaker US Dollar but buyers stay cautious ahead of Germany's prelim inflation data and Trump's reciprocal tariff announcement.

GBP/USD posts small gains near 1.2950 amid tariff woes
GBP/USD keeps the green near 1.2950 in the European morning on Monday. Concerns that US President Donald Trump's tariffs will ignite inflation and dampen economic growth weigh on the US Dollar and act as a tailwind for the pair.

Seven Fundamentals for the Week: “Liberation Day” tariffs and Nonfarm Payrolls to rock markets Premium
United States President Donald Trump is set to announce tariffs in the middle of the week; but reports, rumors, and counter-measures will likely dominate the headline. It is also a busy week on the economic data front, with a full buildup to the Nonfarm Payrolls (NFP) data for March.

US: Trump's 'Liberation day' – What to expect?
Trump has so far enacted tariff changes that have lifted the trade-weighted average tariff rate on all US imports by around 5.5-6.0%-points. While re-rerouting of trade will decrease the effectiveness of tariffs over time, the current level is already close to the highest since the second world war.

The Best brokers to trade EUR/USD
SPONSORED Discover the top brokers for trading EUR/USD in 2025. Our list features brokers with competitive spreads, fast execution, and powerful platforms. Whether you're a beginner or an expert, find the right partner to navigate the dynamic Forex market.