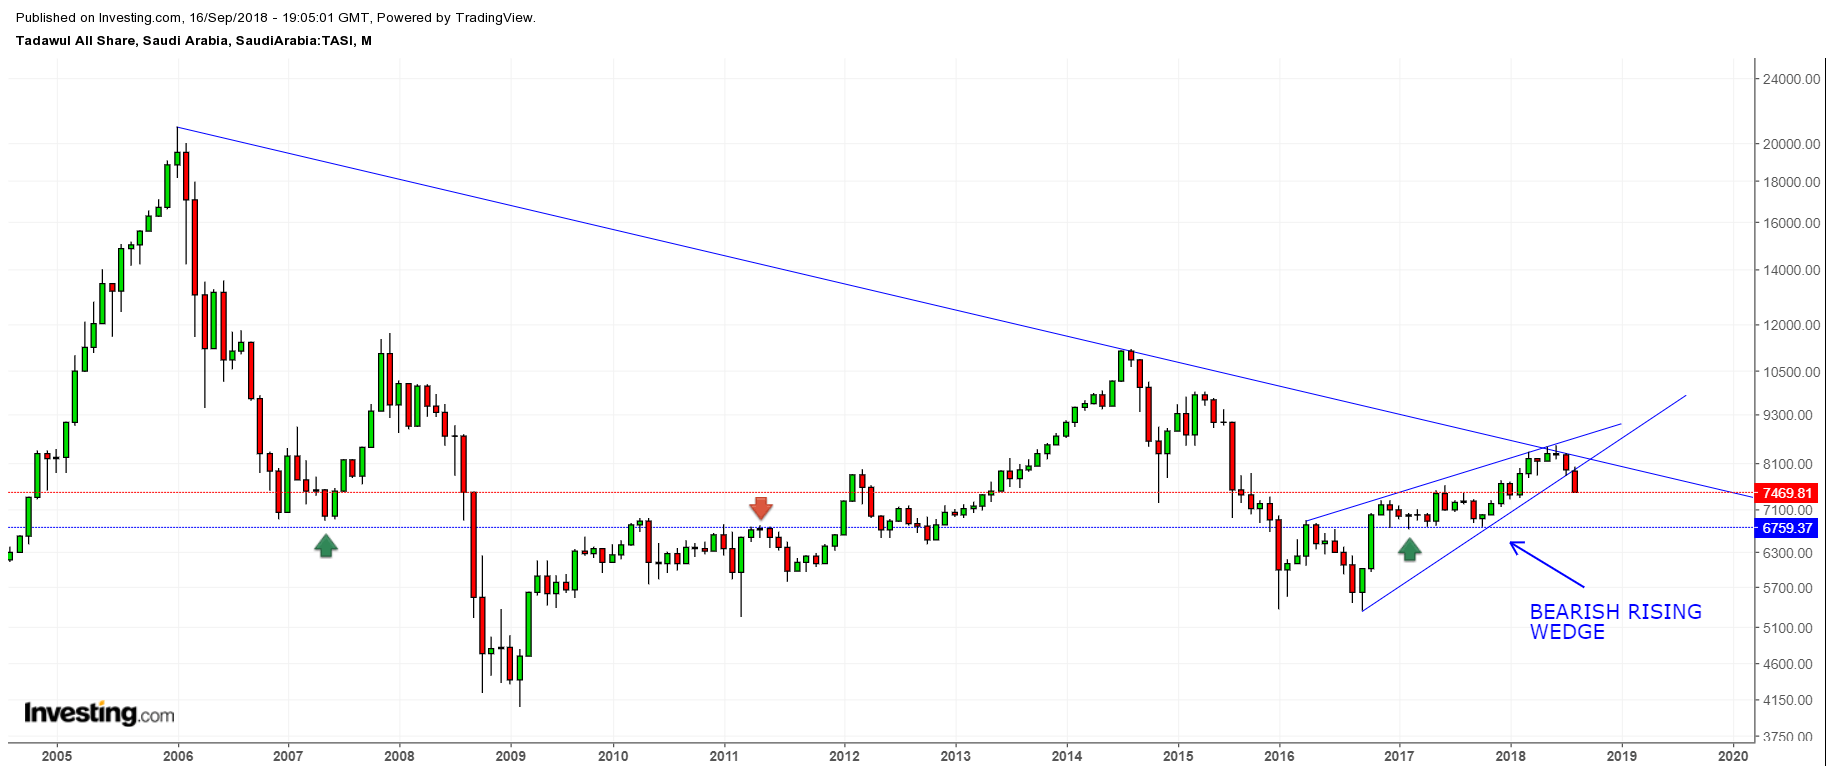
Following a breakdown from a bearish rising wedge several weeks ago, the TASI (Saudi Arabia stock market) seen three consecutive weeks of falling prices. The index is now fast approaching the first key support zone to watch for a potential short-term bounce. Typically, at some point following a breakdown a bearish pattern a counter-trend rally will occur back up towards the breakdown zone (approx. 7,226) to some degree, before a continuation lower kicks in.
Monthly Chart – Tadawul All Share Index (TASI)
The next potential support zone to watch is around the 38.2% Fibonacci retracement zone of 7,289.79. You can see that this support zone is reinforced by prior support and resistance as can be seen on the weekly chart below.
Weekly Chart – Tadawul All Share Index (TASI)
If the 38.2% price zone is exceeded to the downside the TASI next heads towards a price zone from around 6,916 (50% retracement) to 6,710 (prior monthly support). The lower price zone is a key level as it was a low during an eleven-month consolidation zone from 2017 and is part of the larger developing uptrend begun off the October 2016 lows. Nevertheless, if exceeded to the downside the TASI next heads towards the 61.8% Fibonacci retracement of 6,540.43.
The views and opinions expressed here are solely those of the authors / contributors and do not necessarily reflect the views of Marketstoday.net. Neither Marketstoday.net nor any person acting on its behalf may be responsible for information contained herein. The content posted here may have been edited to conform to Marketstoday.net policies, terms and conditions. Any investment / trading related article, analysis or commentary are by no means a guarantee of present or future performance and should not be relied upon solely when buying or selling a financial instrument. Every investment no matter how appealing, involves risk and the investor should conduct their own research, consider personal risk tolerance, preference and needs when making an investment or trading decision.
Recommended Content
Editors’ Picks

EUR/USD drops below 1.0500 after US inflation data
EUR/USD stays under pressure and trades below 1.0500 in the American session on Wednesday. The US Dollar stays resilient against its rivals after the data showed that the annual CPI inflation edged higher to 2.7% in November, not allowing the pair to stage a rebound.

Gold extends rally above $2,700
Gold preserves its bullish momentum and trades above $2,700 for the first time in two weeks. Investors fully price in a 25 basis points Fed rate cut in December following the November inflation data from the US, boosting XAU/USD.

BTC faces setback from Microsoft’s rejection
Bitcoin price hovers around $98,400 on Wednesday after declining 4.47% since Monday. Microsoft shareholders rejected the proposal to add Bitcoin to the company’s balance sheet on Tuesday.

Why is the ECB set to cut interest rates again and what does that mean Premium
The ECB is widely expected to cut interest rates on Thursday for the fourth time this year. This is a significant achievement as it suggests that the ECB, which sets monetary policy in the Eurozone, is accelerating its path towards lower interest rates after an unprecedented increase.

GBP/USD drops below 1.2750, awaits US inflation data
GBP/USD is back in the red below 1.2750 in European trading on Wednesday. The Pound Sterling loses traction amid renewed US Dollar buying as risk sentiment worsens heading into the key US CPI showdown. The US inflation data is key to gauging the pace of Fed's future rate cuts.

Best Forex Brokers with Low Spreads
VERIFIED Low spreads are crucial for reducing trading costs. Explore top Forex brokers offering competitive spreads and high leverage. Compare options for EUR/USD, GBP/USD, USD/JPY, and Gold.

