Swiss market index Elliott wave technical analysis

Swiss Market Index Elliott Wave Analysis - Trading Lounge Day Chart
Swiss Market Index Elliott Wave Technical Analysis
- Function: Bullish Trend
- Mode: Impulsive
- Structure: Orange Wave 3
- Position: Navy Blue Wave 3
- Direction (Next Higher Degrees): Orange Wave 3 (Started)
- Details: Orange wave 1 is complete; orange wave 3 is now in play.
- Wave Cancel Invalidation Level: 11,245.31
The Swiss Market Index (SMI) is currently in a bullish trend, as analyzed using Elliott Wave Theory on the daily chart. The market is in an impulsive phase, defined by the progression of orange wave 3 within the broader navy blue wave 3 structure. The completion of orange wave 1 has initiated orange wave 3, signifying strong upward momentum.
Orange wave 3 is a pivotal phase in the Elliott Wave sequence, often characterized by dynamic and extended price movements within an impulsive trend. Upon its progression, the market is expected to transition into the next corrective phase, adhering to the natural alternation of impulsive and corrective waves within the larger structure.
An invalidation level has been established at 11,245.31. Should the price fall below this threshold, the current wave structure will no longer hold valid, requiring a reassessment of the analysis. This level serves as a critical benchmark for confirming or invalidating the ongoing bullish trend.
Summary:
- The Swiss Market Index is in a bullish impulsive phase, with orange wave 3 advancing as part of navy blue wave 3.
- This stage reflects significant upward momentum within the broader market trend.
- The invalidation level (11,245.31) is a key reference point for maintaining the accuracy of the wave analysis and guiding expectations for future market movements.
- As orange wave 3 progresses, it will set the foundation for subsequent phases in the Elliott Wave sequence.
.png.f082ebe634f3ebac15a94e1cba39831f.png)
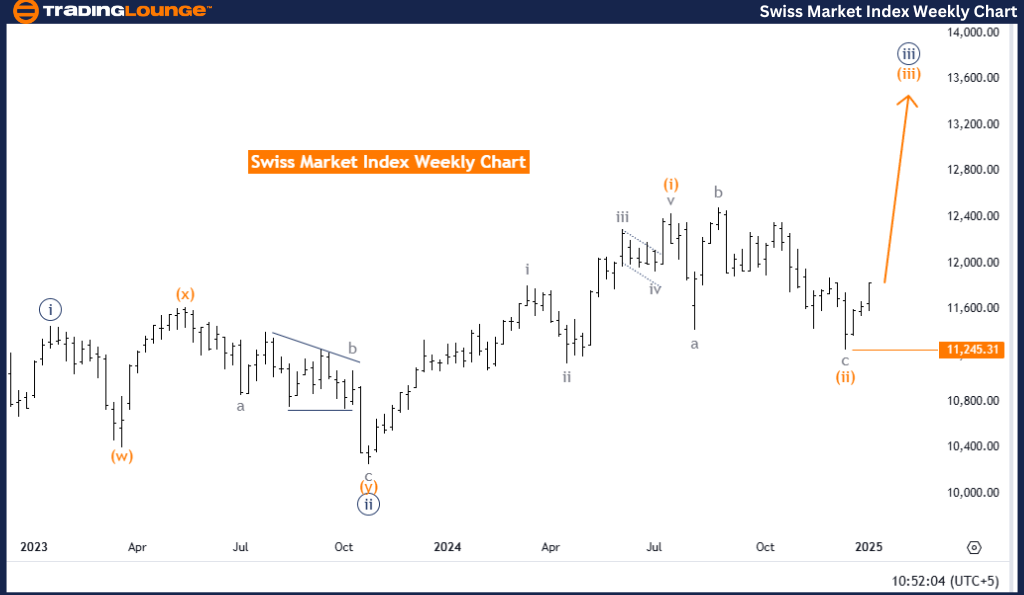
Swiss Market Index Elliott Wave Analysis - Trading Lounge Weekly Chart
Swiss Market Index Elliott Wave Technical Analysis
- Function: Bullish Trend
- Mode: Impulsive
- Structure: Orange Wave 3
- Position: Navy Blue Wave 3
- Direction (Next Higher Degrees): Orange Wave 3 (Started)
- Details: Orange wave 1 is complete; orange wave 3 is now unfolding.
- Wave Cancel Invalidation Level: 11,245.31
The Swiss Market Index (SMI) is currently in a bullish trend, as identified through Elliott Wave Analysis on the weekly chart. The market is progressing through an impulsive phase, marked by the development of orange wave 3, which forms part of the broader navy blue wave 3 structure. The completion of orange wave 1 has initiated the strong upward momentum of orange wave 3.
Within the Elliott Wave framework, orange wave 3 is a pivotal phase, often characterized by dynamic and extended price movements in a bullish trend. This wave reflects the sustained strength of the market and plays a significant role in the broader impulsive structure. As orange wave 3 advances, it establishes the groundwork for potential corrective phases or continued impulsive moves in alignment with the overall bullish trend.
An invalidation level has been defined at 11,245.31. If the price drops below this threshold, the current wave interpretation will be invalidated, requiring a reevaluation of the wave structure. This level is a critical benchmark for ensuring the reliability and accuracy of the analysis.
Summary:
- The Swiss Market Index is in a bullish impulsive phase, with orange wave 3 actively developing as part of navy blue wave 3.
- This stage signifies robust upward momentum within the broader market trend.
- The invalidation level (11,245.31) serves as a key reference point to confirm the accuracy of the ongoing wave structure and guide expectations for future market movements.
- The progression of orange wave 3 reinforces the market's bullish outlook and its adherence to Elliott Wave principles.
Technical Analyst : Malik Awais
Source : Tradinglounge.com
Author

Peter Mathers
TradingLounge
Peter Mathers started actively trading in 1982. He began his career at Hoei and Shoin, a Japanese futures trading company.


