Support and resistance levels running into US CPI

At 1.30 UK today we have high volatility inflation data, Consumer Price Index (CPI). Looking at the DXY (USD Index) we may not get the dramatic moves we have seen in the past.
CPI expected: MoM 0.3% – YoY 5.7%
Below are areas of confluence. This is when two support or resistance levels merge. We look to sync these levels with cypher patterns or Elliott Wave formations to give us a longer-term bias, stop (swing low or high) and target levels (completion of the next leg).
The zones have a time expiry and are only good for the day, unless qualified
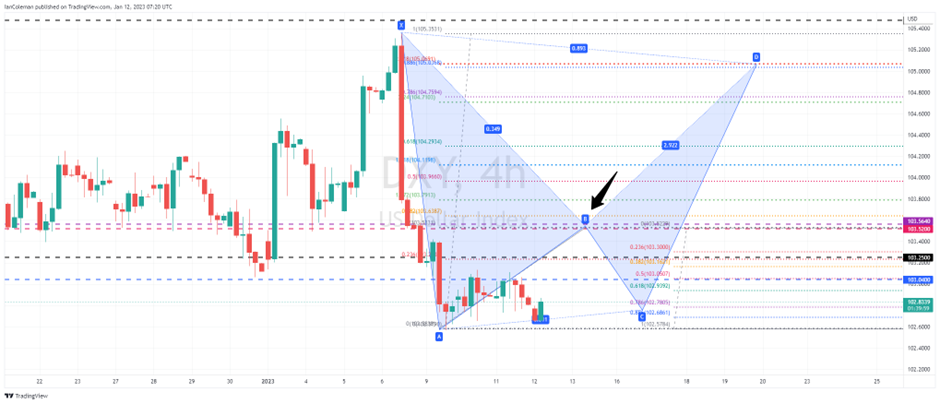
US Dollar Index 4-hour
Resistance located at 103.52-56. This would suggest that, after an initial rally, we correct lower in the BC leg, the hardest leg to trade. This is counter trend and care should be taken. Normal pullbacks are 38.2 or 88.6% of leg AB (103.16-102.68).
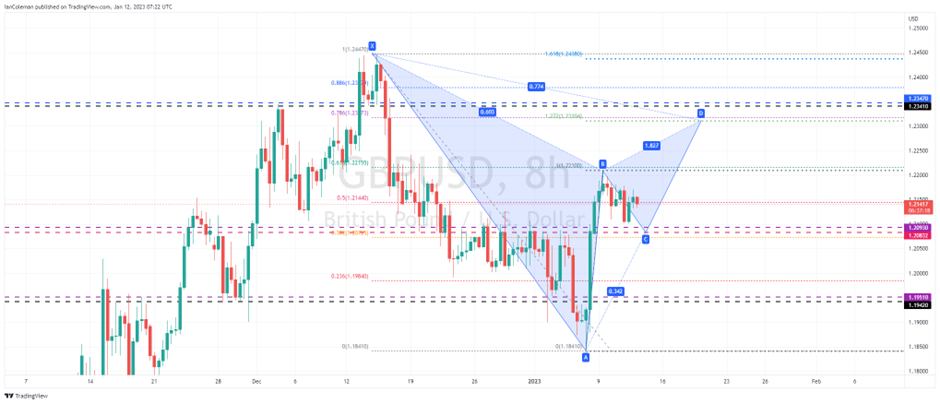
GBP/USD 8-hour
The favoured pair as we would be trading in the direction of the long-term trend. 1.2093 – 86 support zone. The target level would be the 1.2310 Fibonacci confluence zone, forming a bearish Gartley
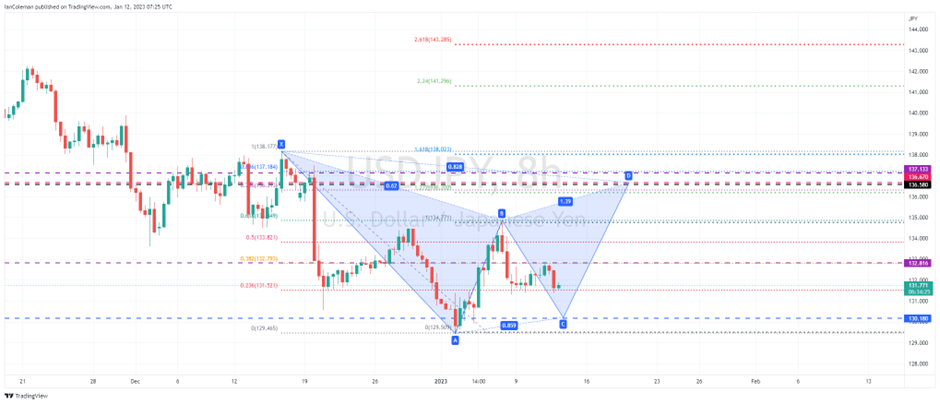
USD/JPY 8-hour
Going to throw this one into the mix even though the system trade is selling the completed pattern at 136.20. The risk/reward is substantial, coming in at 7.7R, to buy the dip at bespoke support of 130.18.
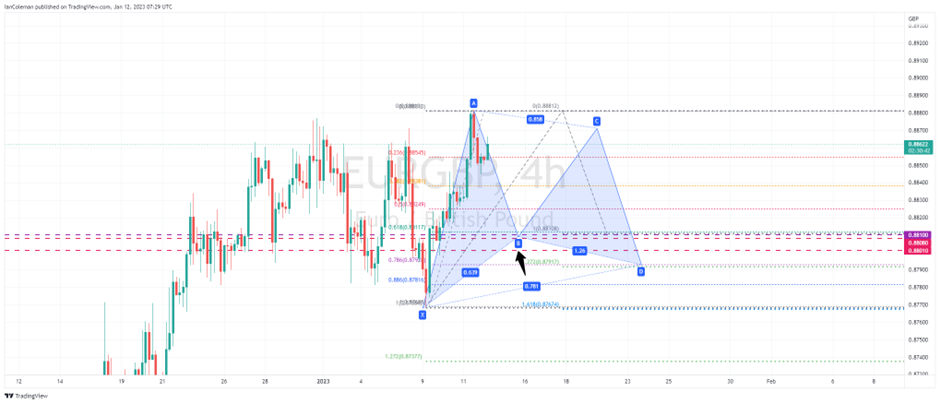
EUR/GBP 8-hour
Not USD based but a cross that we covered yesterday. We have a confluence area at 0.8810 and 0.8807. With this being close to the 61.8% pullback level at 0.8811, it would suggest a temporary correction higher.
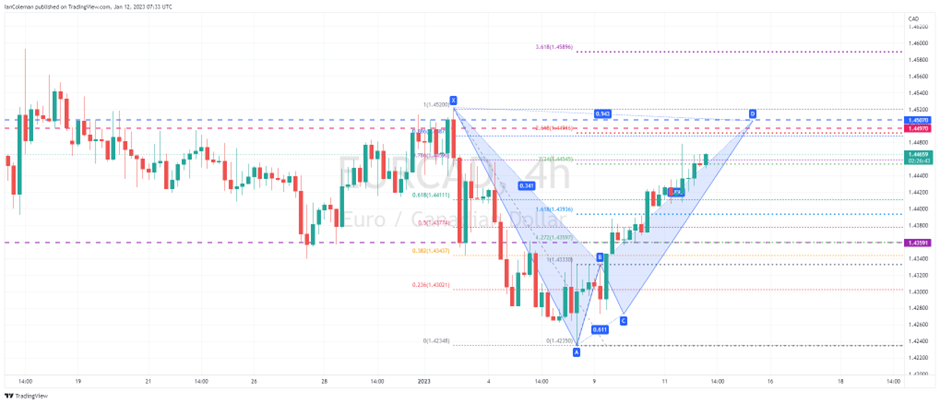
EUR/CAD 8-hour (good until the Friday close) – Offers huge potential
Completing a bearish Bat formation at 1.4491. Bespoke resistance is located at 1.4497-1.4507. This offers a tight stop as the pattern is invalidated on a move through 1.4520.
EUR/CAD weekly
What I love about this setup is the potential from the weekly chart. This highlights the next leg lower being BC. The 38.2% pullback level is 1.3936. The 88.6% pullback level is 1.3076.

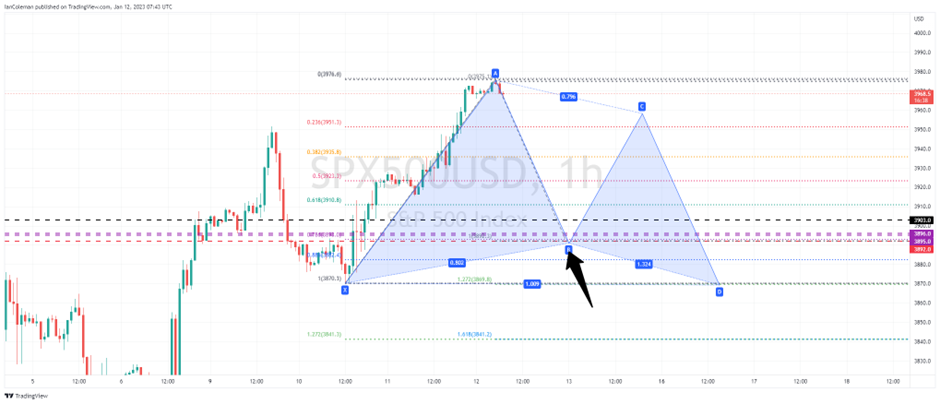
S&P 500 4-hour
If we see a move to the downside in US stocks, the SPX500 has a support zone at 3896,3895 and 3892. With this being a 78.6% pullback level of the 3870-3976 move, we could see a corrective bounce.
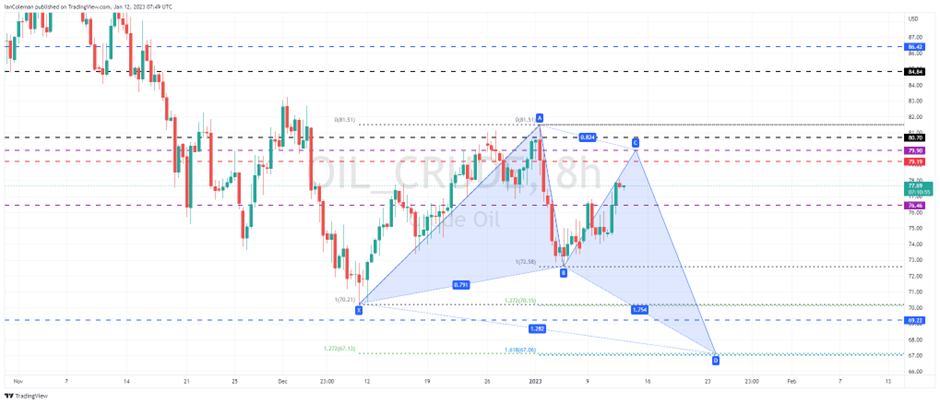
Crude Oil 8-hour (weekly expiry)
The resistance zone is seen at 79.90 and 80.70, perhaps fading both levels. The target level to complete the Butterfly formation is seen at 67.13. A move above 81.51 invalidates the pattern. Taking an average fade-in at 80.30, this offers a risk/reward rate of 10.5(r).
Author

Ian Coleman
FXStreet
Ian started his financial career at the age of 18 working as a Junior Swiss Broker at Godsell Astley and Pearce (London). He quickly moved through the ranks and was Desk Manager at RP Martins at the age of 29.


