Sugar: Sellers Entered In The Blue Box As Anticipated

We always refer a lot to the blue boxes which are often shown on our charts and define them as High-Frequency areas which are based in a relationship of sequences, cycles and calculated using extensions. Traders are always looking for answers and news to decide what to do next, whether to buy or sell, whereas we are always looking for the Blue Boxes and the relationship between Instruments, cycles, and sequences to guide members into the next trading opportunity. Our motto is do not trade the hype, trade the sequences and technical levels. We believe it’s the patterns and the cycles which determine the next move in the market and news only acts as a trigger to start the move in that direction or acts a catalyst and make it happen more quickly than it would have happened under normal circumstances. In this article, we would look at the forecast of Sugar for the past few months or so and how it reacted after reaching the blue box area that we had highlighted on the chart.
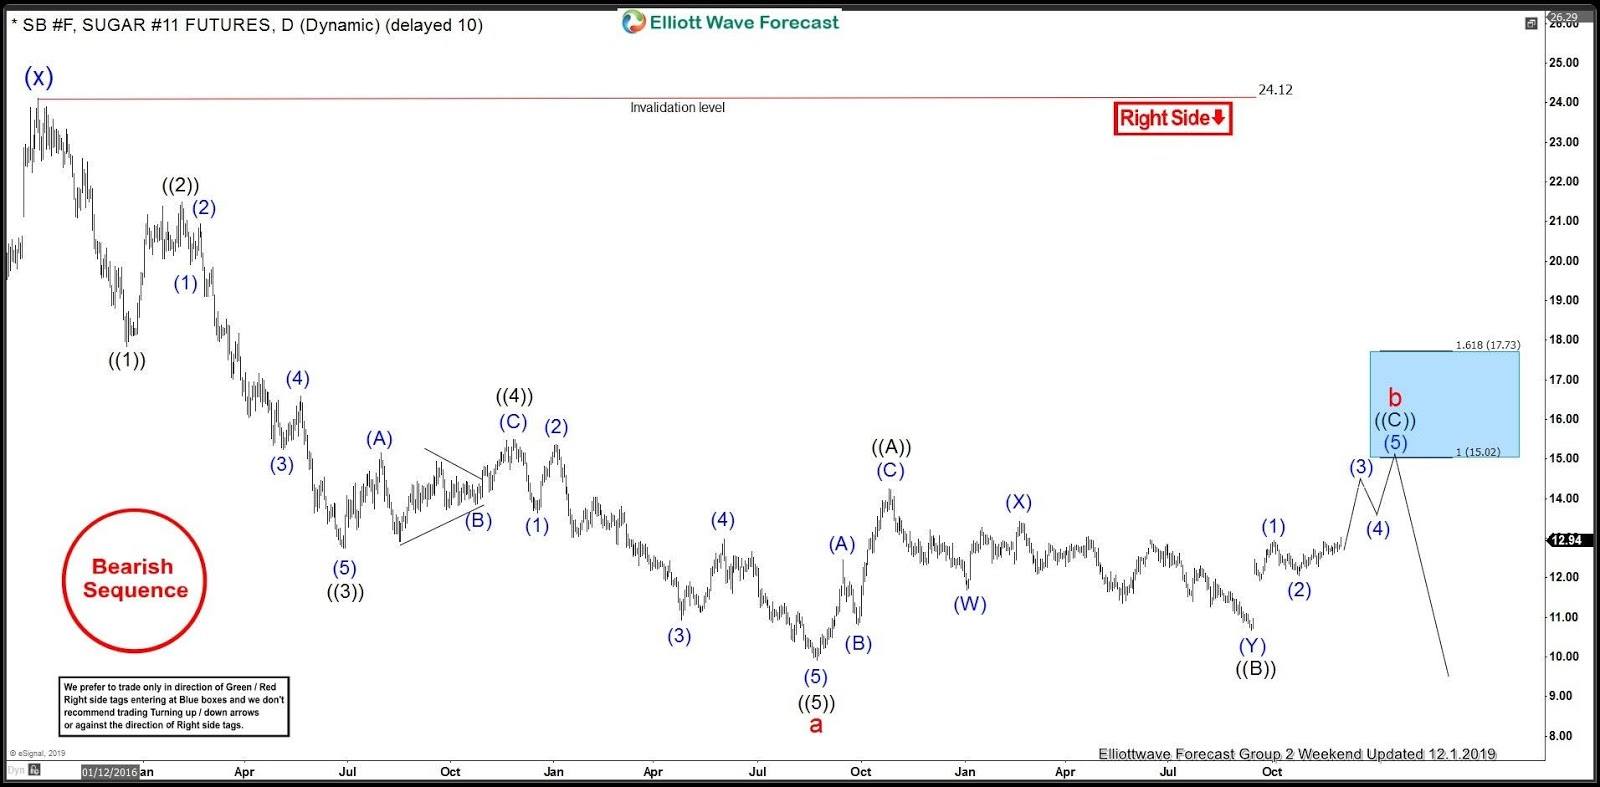
Sugar (SB_F) Daily Elliott Wave Analysis 12.1.2019
Sugar daily chart below shows that it completed a 5 waves decline at $9.91 on August 22, 2018. This 5 waves Elliott wave impulse started back in September 2016 @ $24.12 After an impulse lower, a recovery should take place in either 3, 7 or 11 swings which is the corrective sequence of the market. In the chart below, we can see Sugar already did a 3 waves recovery to $14.24 and then pull back in 3 waves to $10.68 and started pushing higher again. As the decline from $14.24 was a corrective 3 waves decline and the rally from $10.68 low was in 5 waves, we called another leg higher toward $15.02 – $17.73 area to finish the correction from $9.91 low.
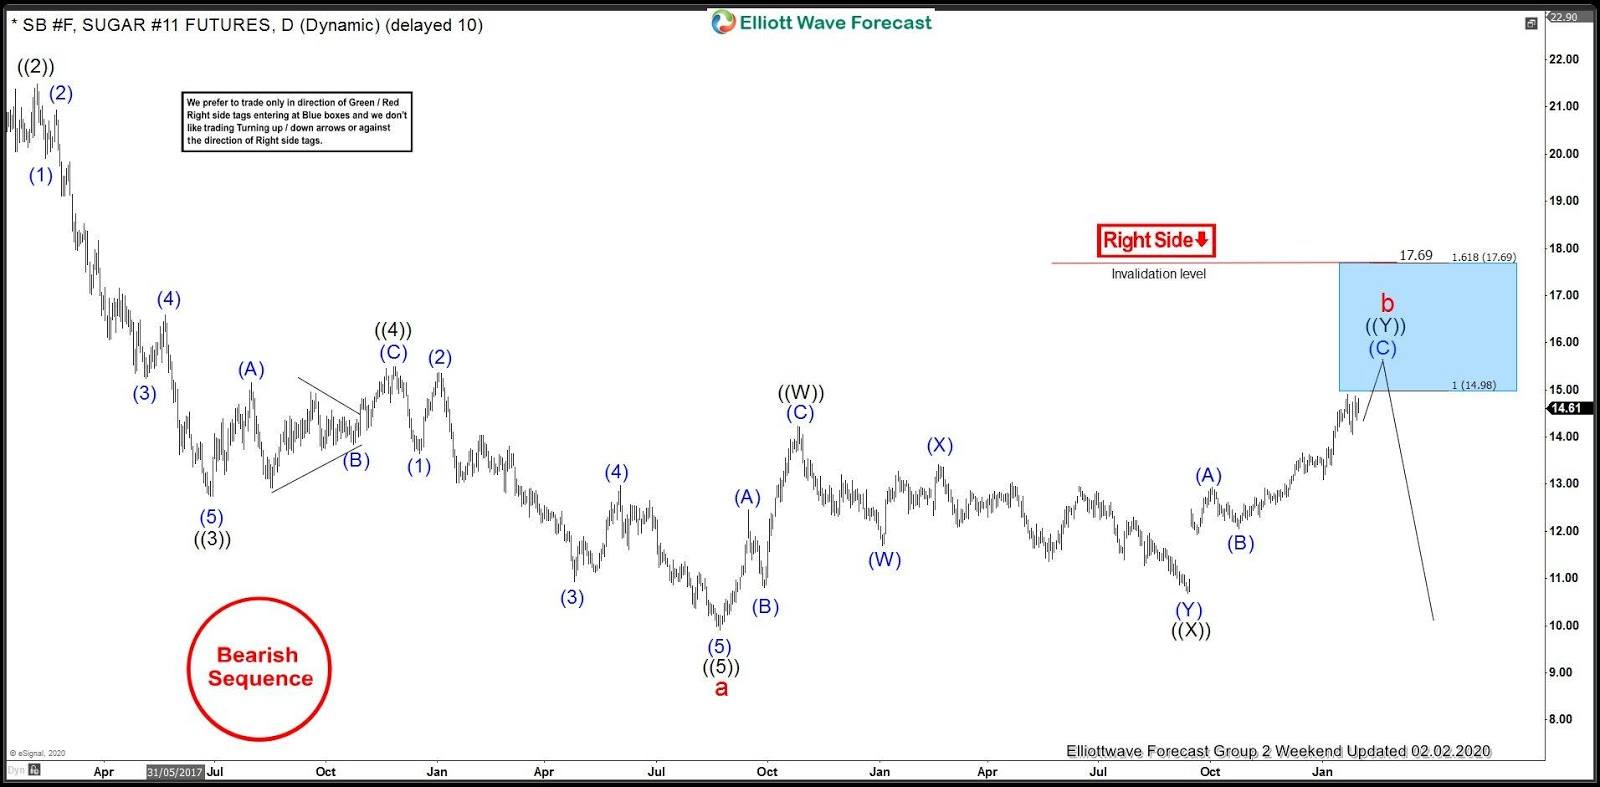
Sugar (SB_F) Daily Elliott Wave Analysis 02.02.2020
Chart below shows Sugar continued the rally as expected and has almost reached the blue box area that we showed back in December 2019. As it was nearly at the blue box area, we changed the preferred wave count from a 3-3-5 FLAT structure to a double three Elliott wave structure. It was still possible for Sugar to correct the cycle from October 2019 low and make another high to become 5 waves up from $10.68 and a FLAT from August 2018 low. In either case, blue box highlighted the extreme area up from August 2018 low and we expected the bounce to finish in this area and the decline to resume either for a new low below August 2018 low or a larger 3 waves pull back at least.
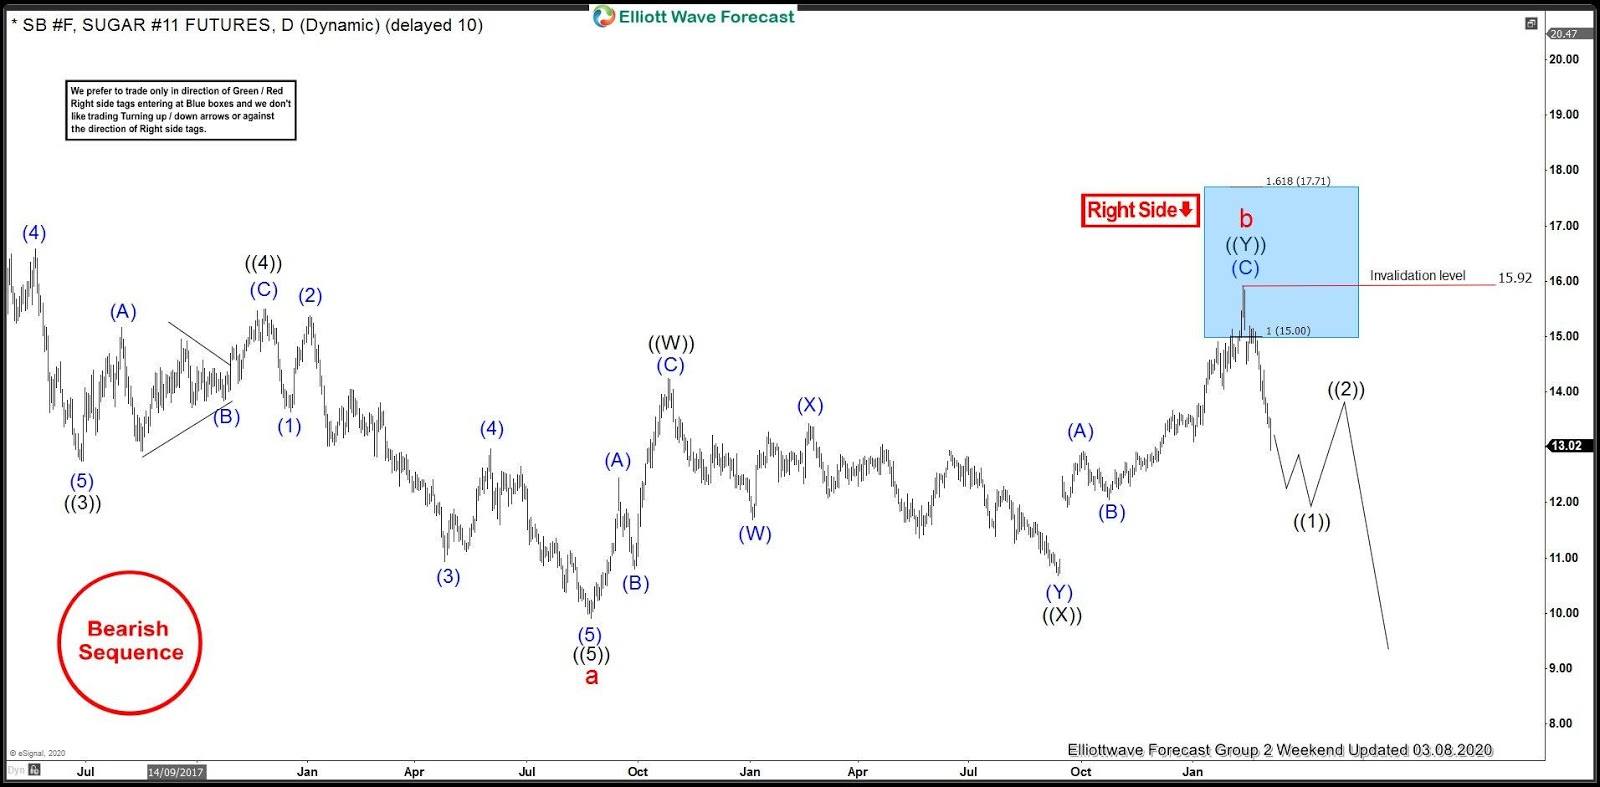
Sugar (SB_F) Daily Elliott Wave Analysis 03.08.2020
Sugar chart below shows it reached the blue box and has started reacting lower as expected. Sellers were waiting in the blue box and have started pushing prices lower. Decline from the peak is so far in 3 waves but is beginning to look impulsive. If it does manage to complete 5 waves decline from the peak at $15.92, that would add conviction to the view that next leg lower to break below $9.91 low is already in progress. In either case, we have already seen the minimum reaction lower from the blue box which reached 50% Fibonacci retracemne of the rally from black ((X)) low at $10.68 which means any sellers which entered in the blue box should already be in a risk free position.
Author

Elliott Wave Forecast Team
ElliottWave-Forecast.com


