Stop-loss run with reason

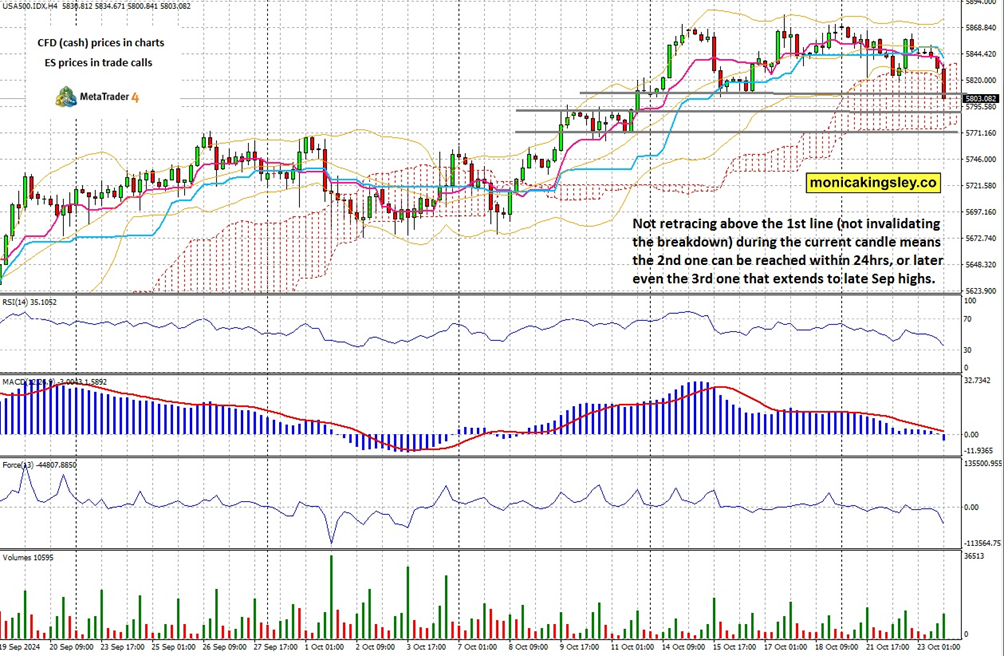
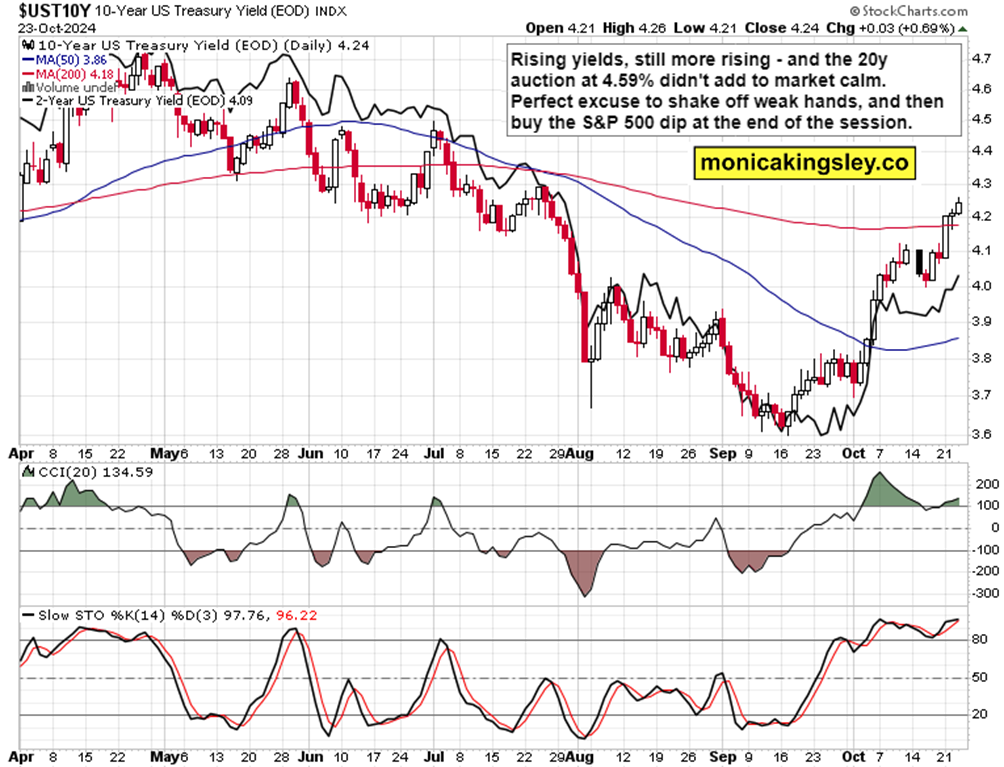
S&P 500 didn‘t challenge Tuesday‘s highs, and wasn‘t bid up after the opening bell either. The lower border of recent range at 5,865 provided little in terms of support, and what I had been warning about at the beginning of the week (that should this level be broken, 5,815 comes fast), came true – on the heels of a weak 20y Treasury auction.
Let‘s quote what I wrote to premium swing trading clients before the open yesterday, and follow this up with the S&P 500 chart with more support levels outlined, published in our intraday channel when the uppermost level started to break.
(…) During a tight S&P 500 range, it‘s best to focus on rotations so as to read the tea leaves. Even the daily candles show downswing rejection – yesterday was ideal opportunity to break below 5,865, but the level held again – and several key sectors are moving somewhat favorably to the buyers. Today, we‘re likely to see again some opening weakness, but institutions will buy the dip during the day – as they have been doing for more than a couple of weeks really.
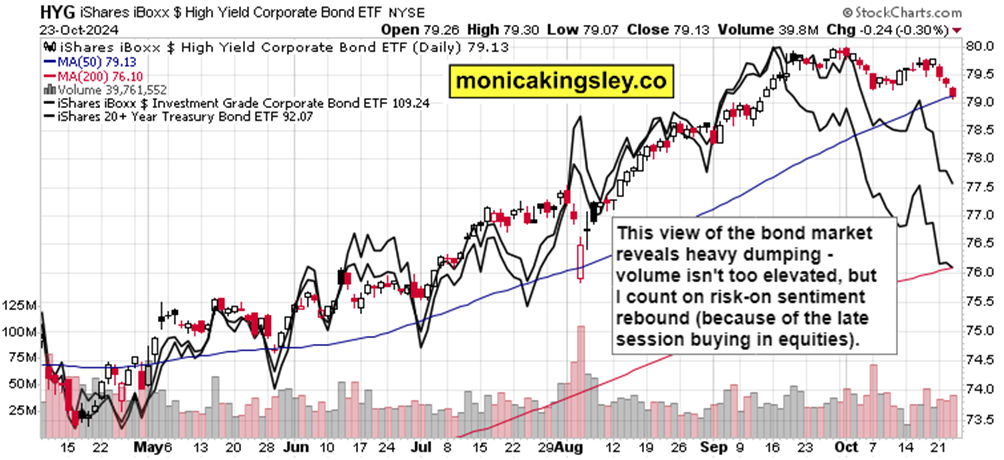
Congrats to Ellin who navigated the quick plunge all the way to the closing bell, with TSLA call on top. Quick plunge I say, because the break of key supports as shown below in this tweet took a single 4hr candle. Apart from the S&P 500 chart, let me show you a full bond market perspective with notes as well.
Author

Monica Kingsley
Monicakingsley
Monica Kingsley is a trader and financial analyst serving countless investors and traders since Feb 2020.


