Stock indices may crash again soon

2022 was tough for almost all investors. Stock indices, cryptocurrencies along other assets rapidly declined in value, which made a lot of market participants look for a bottom. Buying the dip for a millionth time, however, resulted in a loss for many.
Some of the ways investors can avoid heavy losses are dollar-cost averaging or look in which direction the asset is moving. Currently, there is an obvious bear market on stock indices and many think the recession is over. Is it?
DAX is massively overbought
DAX finally hit our target, so we are turning bearish. While the recession is ongoing, the German stock index was able to rise by 21% in just a month and a half. This is more than twice the average annual return of S&P 500. When DAX broke the trend line, there was a significant bullish momentum drawing the market higher. However, can the momentum last?
DAX jumped to levels not seen since June, filling a weekly and a daily gap. The level 14,440 posed a temporary stop on the stock index, possibly forming a peak. Bearish divergences also suggest another move downward is high likely. Although there is a strong bullish trend line, DAX is very probably heading to the down side.
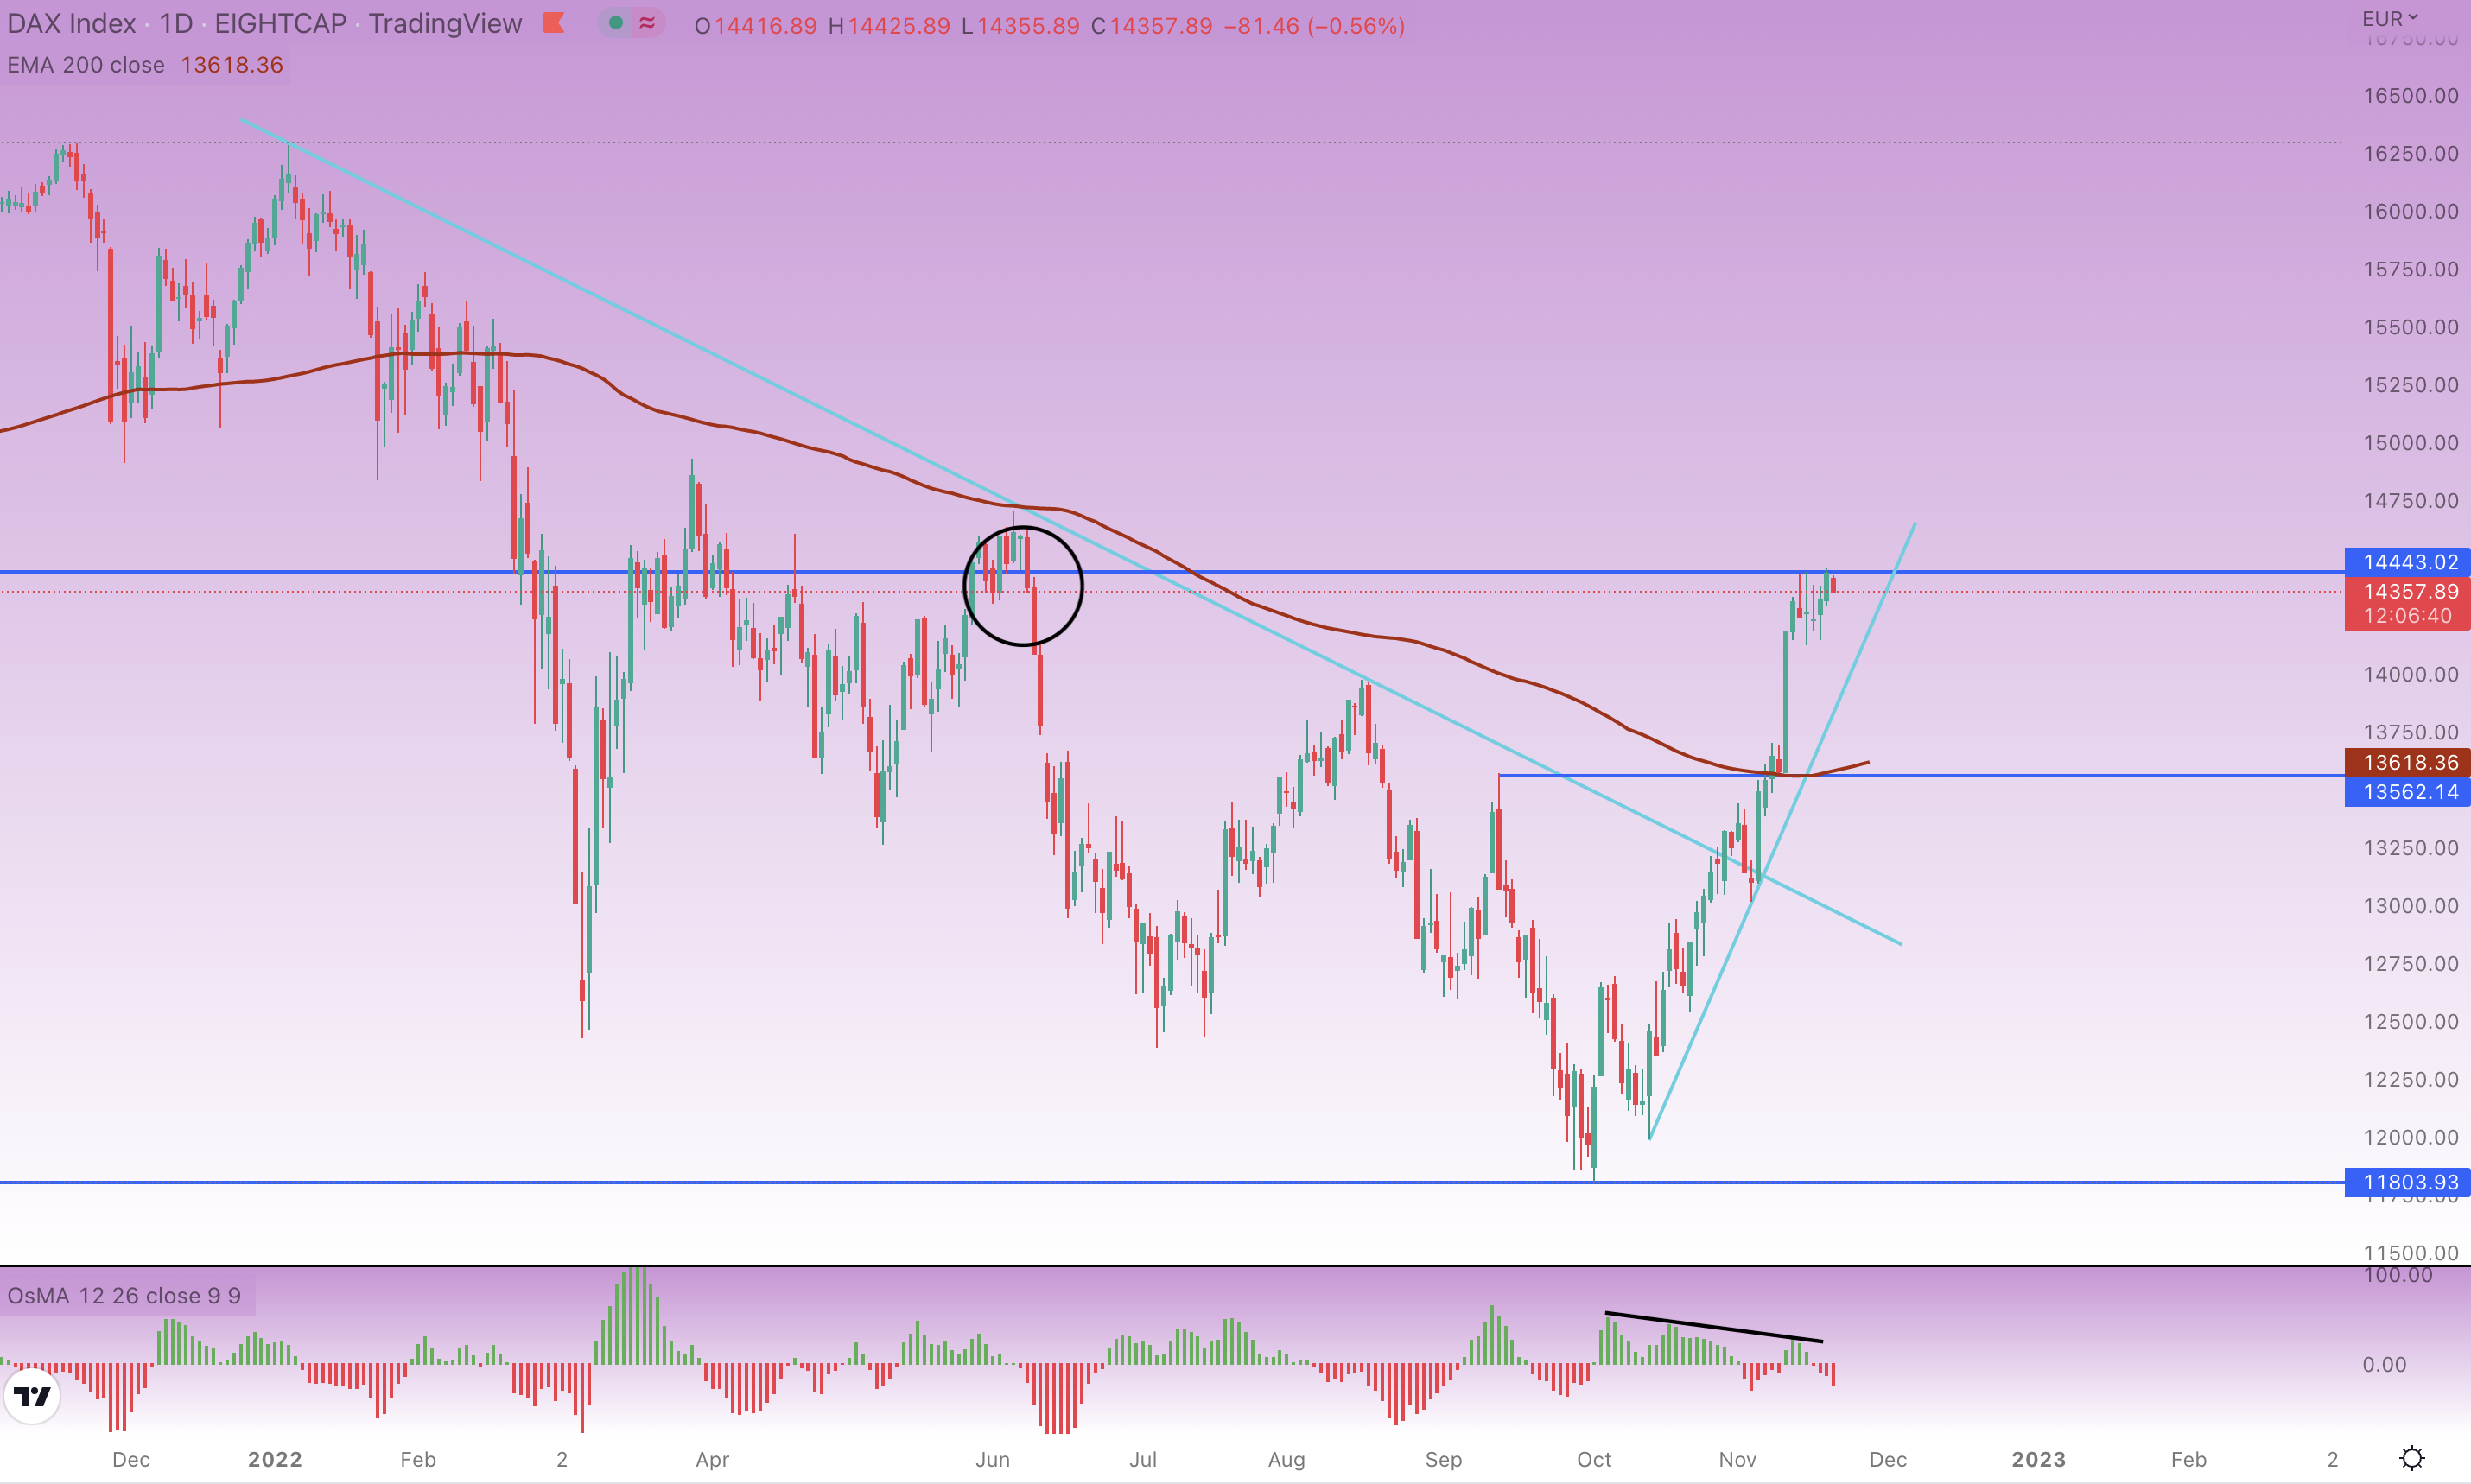
Better than forecasted inflation data from the US helped European and American stock indices jump, but the current market trend is just a relief rally. The bear market is still present, so traders along with investors should be cautious when entering their positions. Even if DAX should jump higher, a pullback to the closest support is still very likely. Hence the profit target of approximately 800 pips.
S&P 500 near an important trend line
S&P 500 also jumped after US inflation data by 5%, but refused to rise higher. This American stock index is in trouble unless it breaks above the trend line because it’s holding the current bear market. S&P 500 recently filled the gap (the circle on the left) and bounced from a 200-day moving average (EMA).
A bearish divergence also suggests that a move downwards is more than probable. Volatility may be lower as the year is ending, so traders can also expect a consolidation between 3,900 and 4,000. But if the index moves lower and the bearish signal is confirmed, S&P 500 could be moving even further than the last time - all the way to 3230-ish.
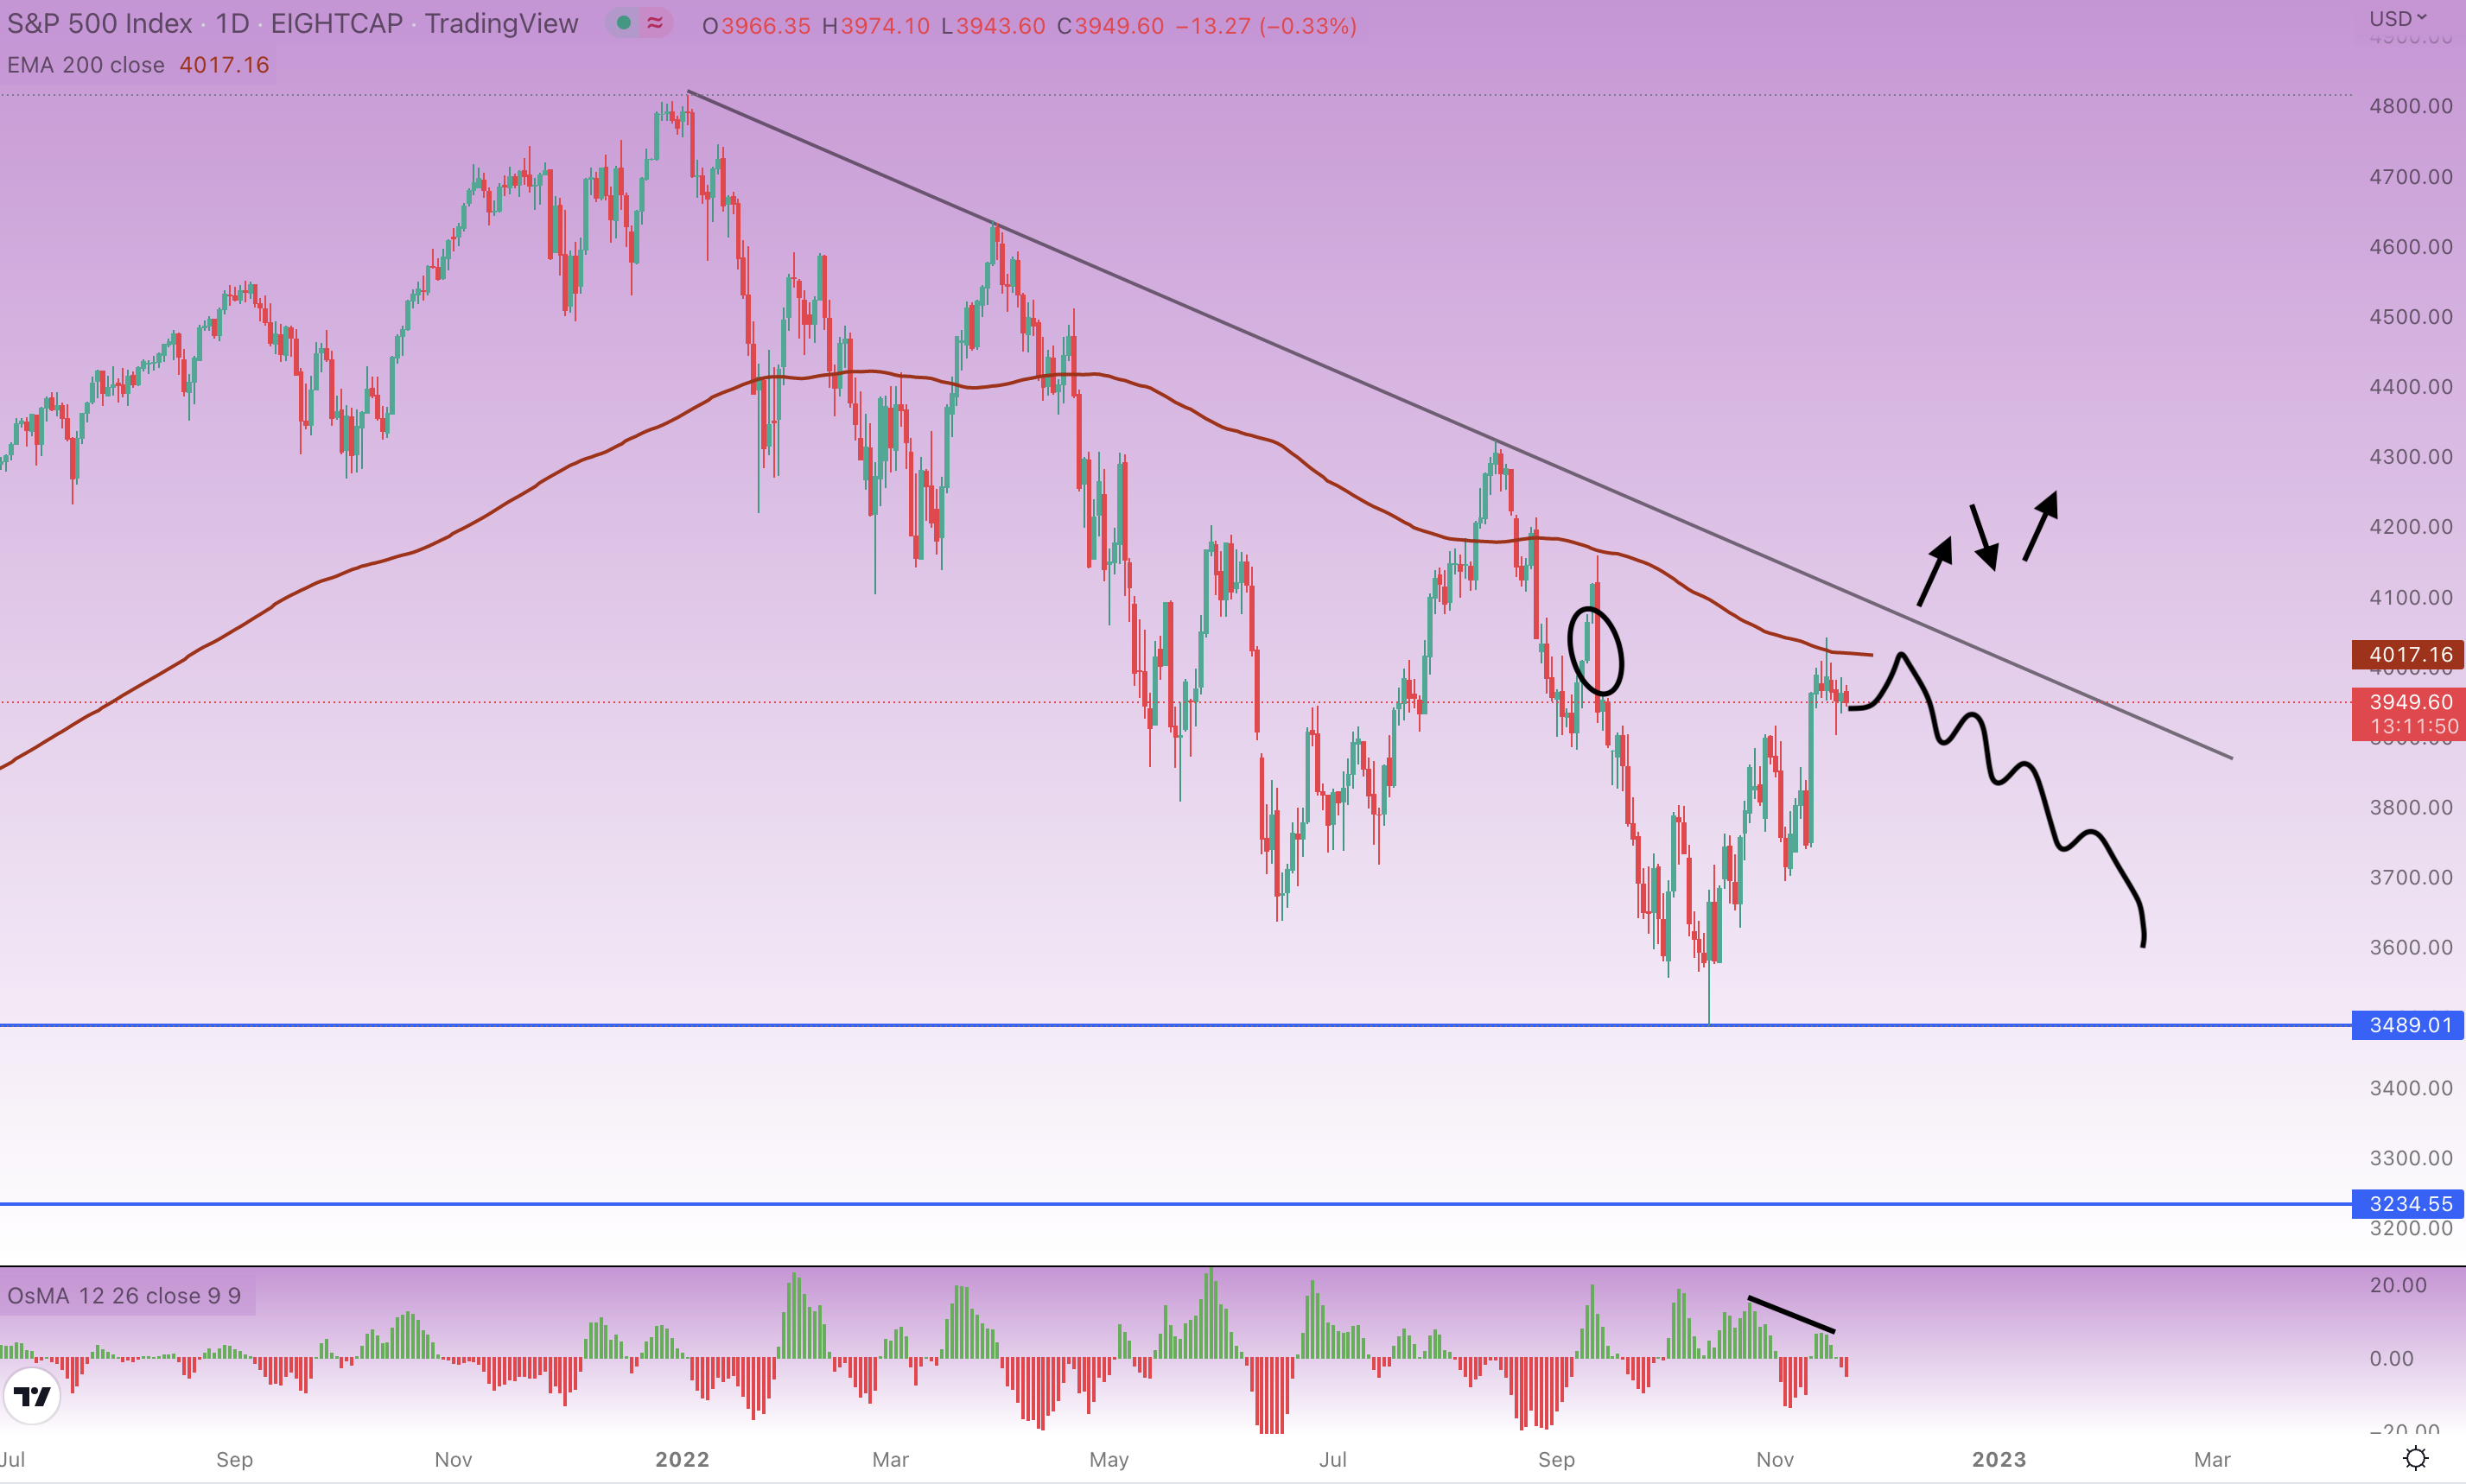
If the long-term uptrend is supposed to hold, it will be crucial to break the trend line, which could send the stock index back to 5,000 or higher. This is, however, very unlikely due to an ongoing economic downturn and clear bearish signals from the chart. S&P 500 may move to 3,800 or lower by the end of the year.
Nasdaq could fall below 10,000
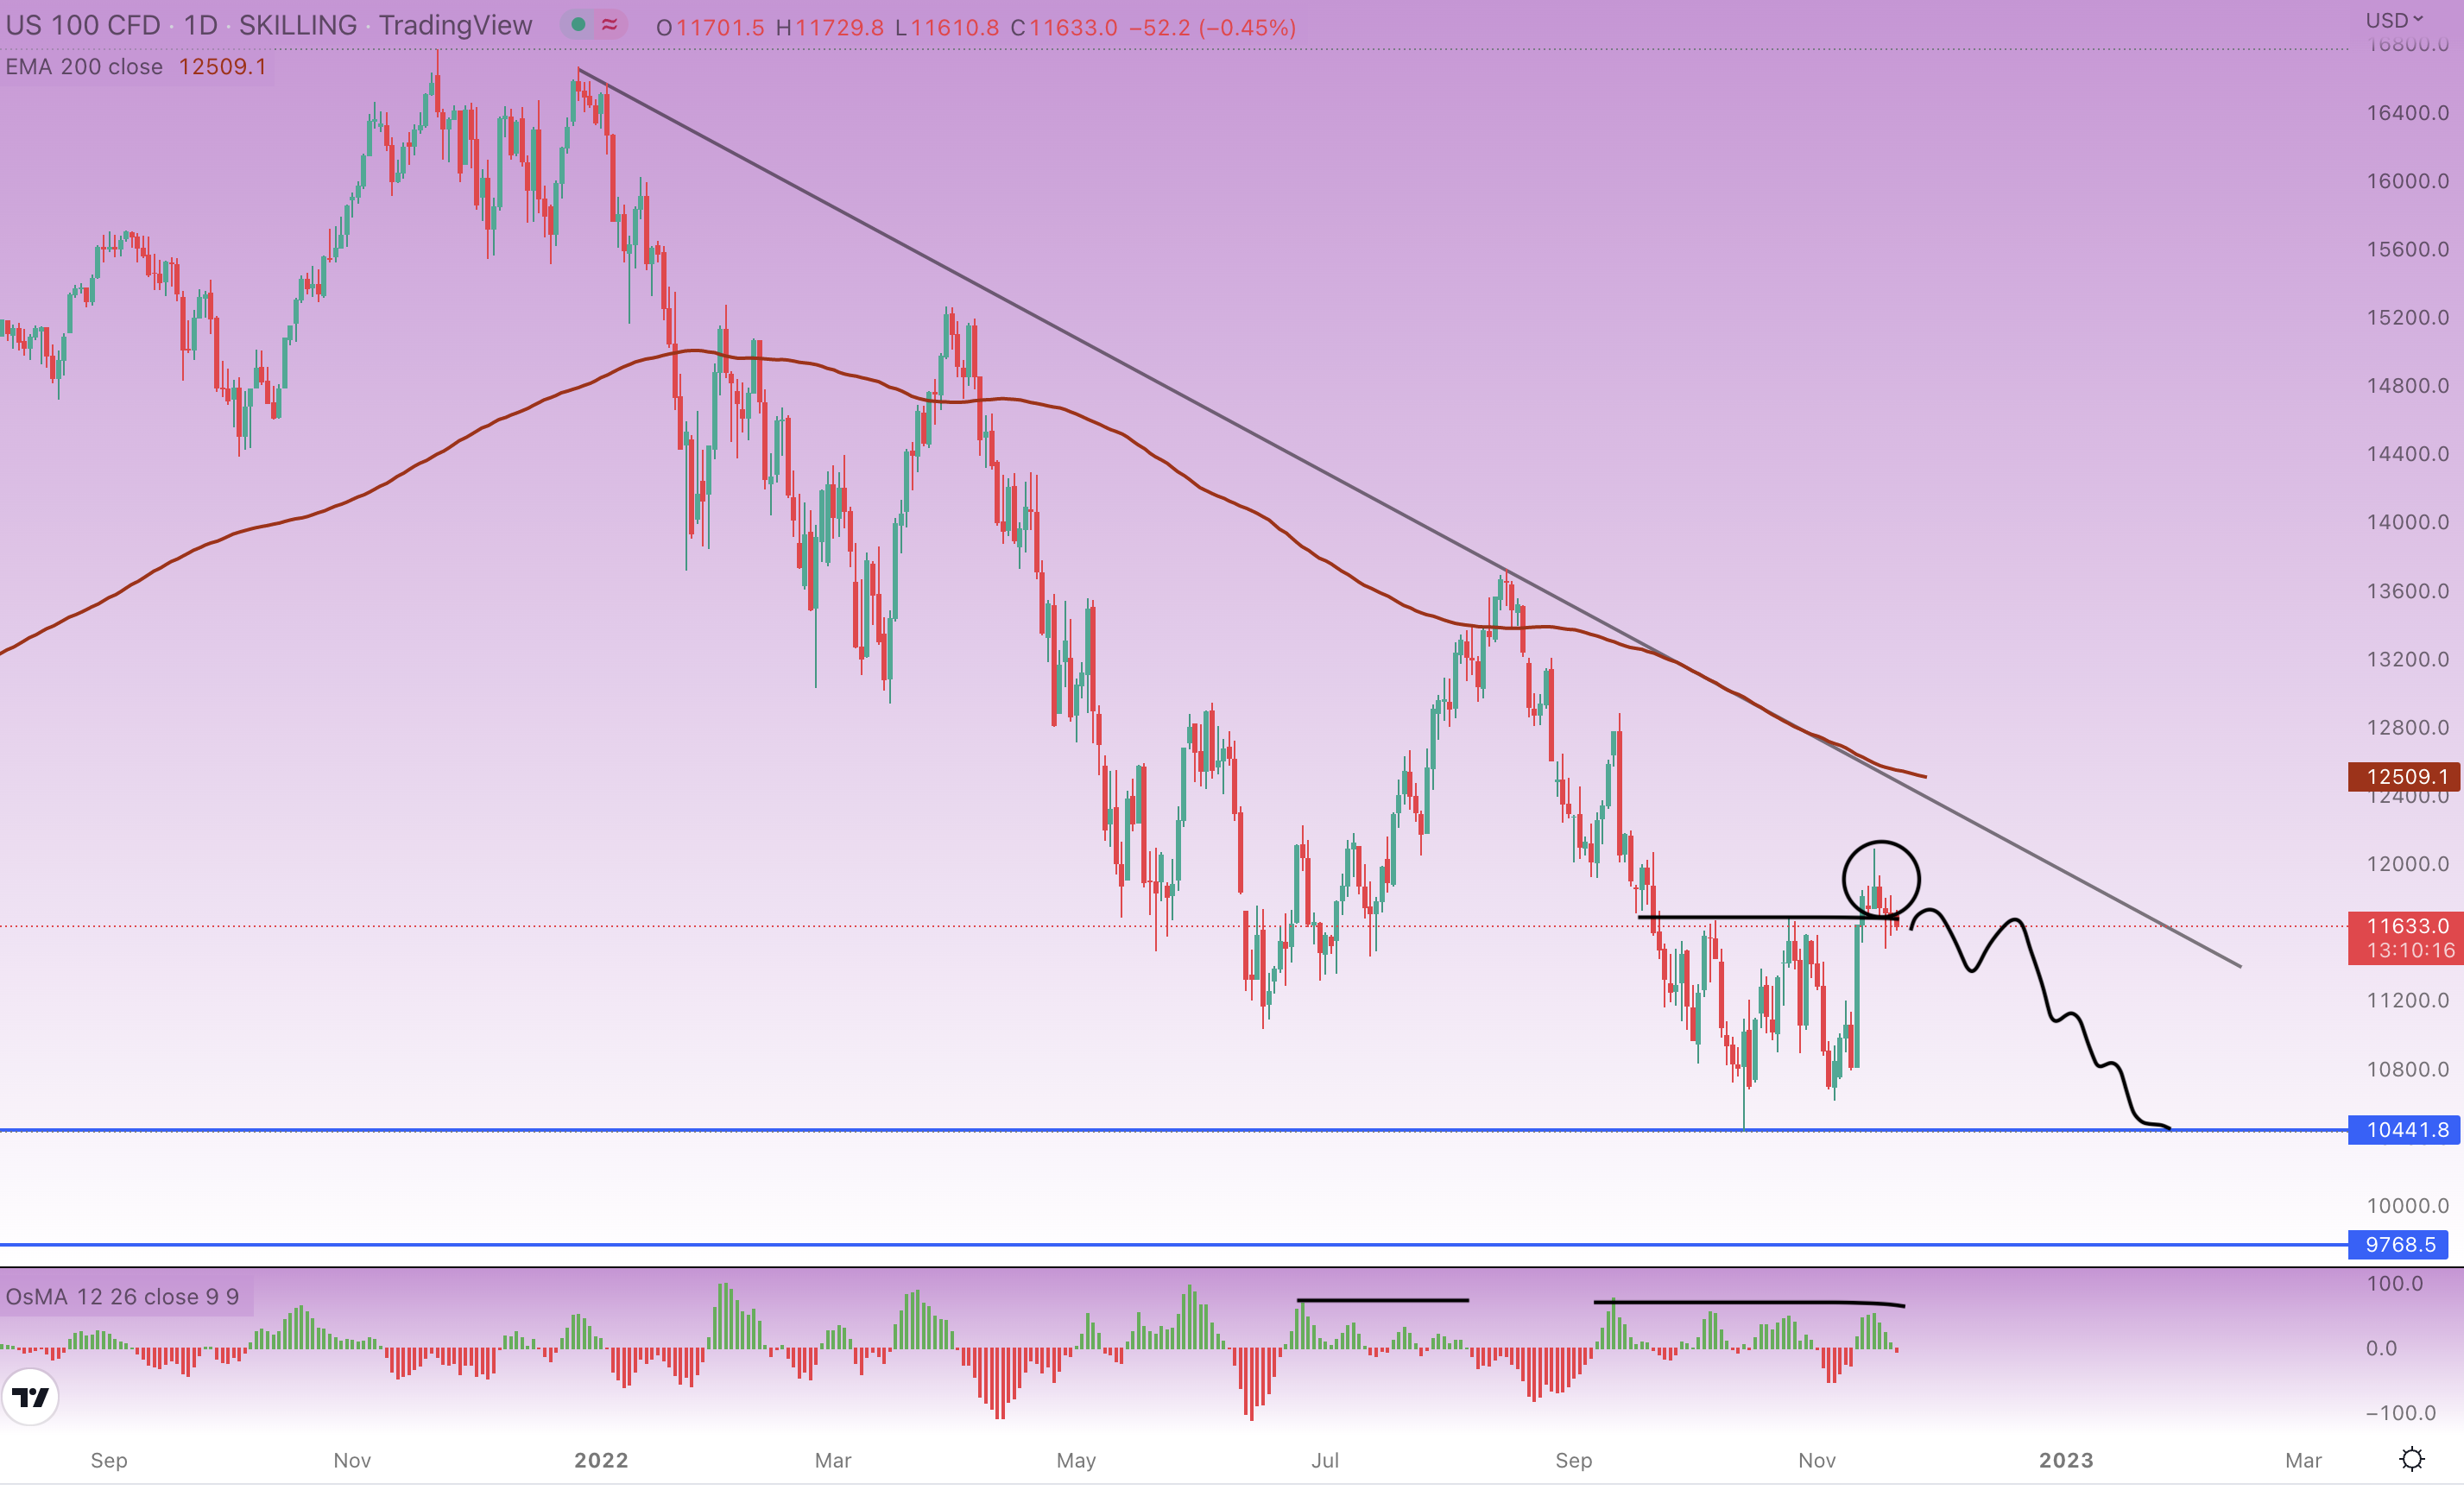
Nasdaq jumped even higher than S&P 500 during the inflation data report. This technological stock index soared 7%, a little above the previous resistance as seen in the chart. Nasdaq is consolidating between its bottom and current resistance, also offering a short signal. A pin bar suggests the stock index might be moving to 10,440 or even lower.
The OsMA indicator shows how overbought Nasdaq currently is and how it ended up last time when this occurred. On the other hand, Nasdaq still didn’t bounce from the trend line or EMA200 like S&P 500 did. A little swing move upward may come to 12,000, but the stock index is still very likely to move below 10,000 in the upcoming months.
Bottom line
The stock market is in a bear market since the early 2022 despite the current relief rally. That’s a fact. Long-term investors may profit in the future, but certain technical and fundamental tools point to another move downward soon. Traders need to stay cautious if shorting indexes as they rise in the long run, so don’t forget to apply risk management and stoploss.
Author

Rene Remsik
Investro
Rene got into financial markets by accident in 2012 and started with Forex trading. Later in 2017, he started investing in stocks in cryptocurrencies and began writing articles professionally.


