Stagflation fears and soaring us yields: S&P 500's next move
- The Federal Reserve's hawkish outlook for 2025, with plans for only two small rate cuts, has triggered a significant selloff in the S&P 500, raising concerns about stagflation.
- The S&P 500 experienced its biggest one-day drop since August, and the Volatility Index saw its second-largest daily jump in history.
- Technical analysis suggests a break in bullish structure, with the S&P 500's next move depending on the daily candle close and US Treasury Yields.

FOMC Reaction and Implications
Yesterday's significant selloff was inspired by the Fed shifting to a hawkish outlook for 2025. They now plan for only two small rate cuts totaling 0.5% during the year.
This change has sparked fresh worries about the risk of stagflation as we head into the new year. While some investors hope that excitement around AI might help balance out these concerns, the recent surge in risk-taking may start to lose momentum.
The S&P 500 ended down nearly 3% on Wednesday, its biggest one-day drop since August.
Yesterday's 74% surge in the Volatility Index, $VIX, marked its 2nd largest daily jump in history. While the S&P now has had 13 straight days with a greater number of S&P 500 components closing lower than those closing higher, the longest streak since 1978.
This will raise further questions about a bubble as Tech and AI stocks continue to drag the index higher.
Wall Street recovery faces hurdles
Wall Street Indexes have attempted a recovery today which has run into renewed selling pressure. Part of this has been attributed to concerns around a rise in US Treasury Yields moving into 2025 as markets come to terms with the Federal Reserves projections.
The S&P 500 was recently trading at 22 times earnings expectations for the next 12 months, well above its long-term average of 15.8 times, according to LSEG Datastream. Despite these concerns, the incoming Trump administration still has market participants optimistic which could cap further losses.
Moving forward there is a train of thought that US stocks could use bond markets as its guide heading into 2025.
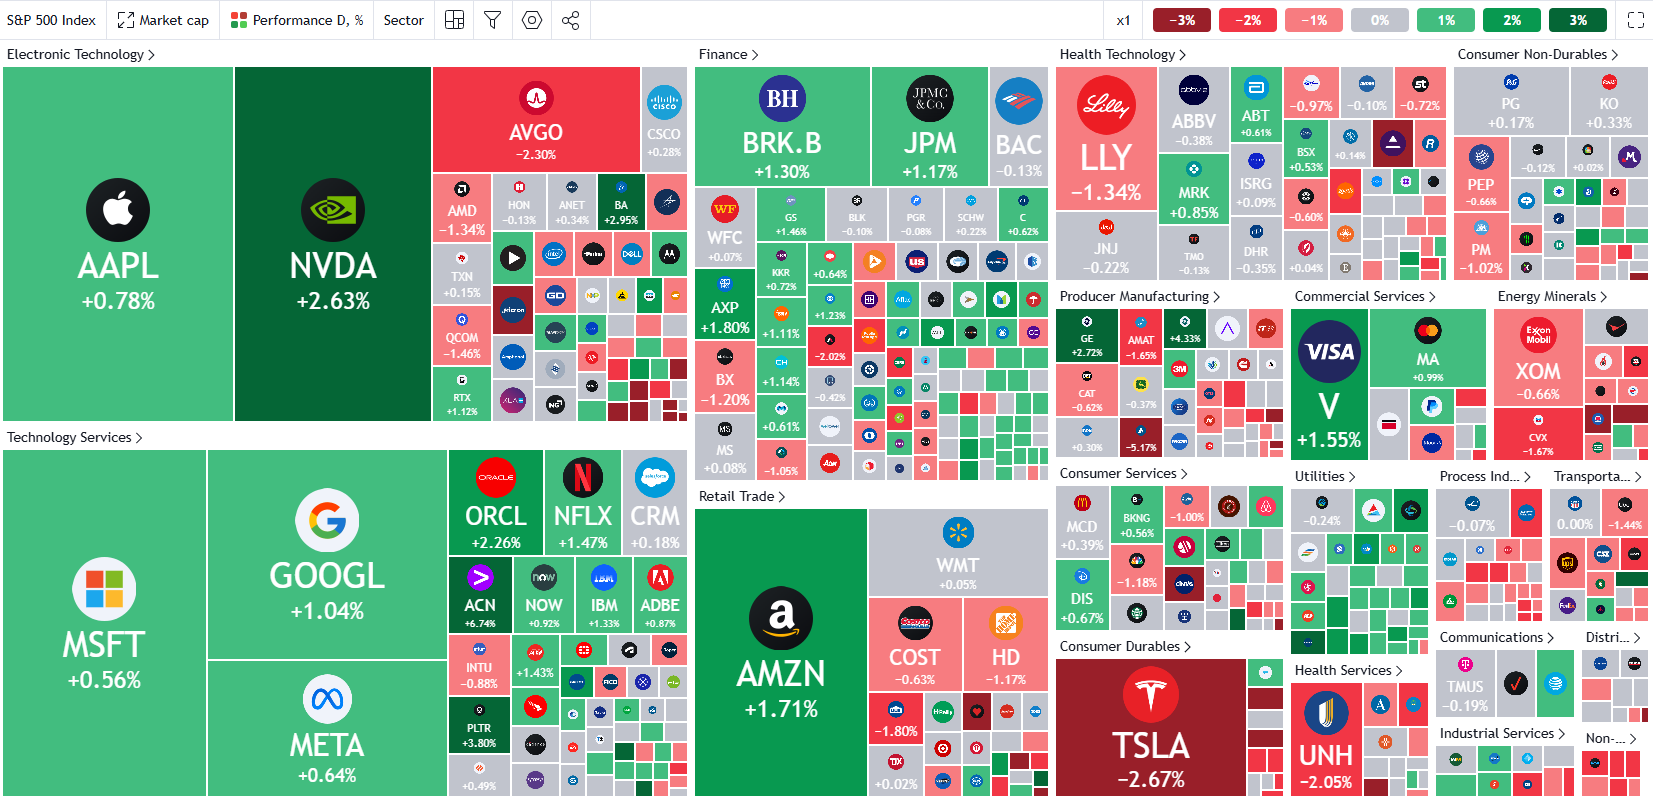
Let us take a quick look at the heatmap for the S&P 500.
Technical analysis S&P 500
From a technical standpoint, the S&P 500 has broken bullish structure on a daily timeframe with a candle close below the previous swing low at 5871.10.
Today's rally met resistance at 5910 before falling back to trade almost flat at the time of writing.
Today's daily close will be an intriguing one and could provide price action clues as to the index's next move.
A daily candle close above the 5871 handle would see a bullish inside bar candle close on the daily timeframe. This would hint at further upside in the days ahead, however as mentioned, keep an eye on US yields. A steady rise in US Yields could halt any attempted recovery.
A daily candle close below the 5870 would hint at further downside ahead for the S&P 500. A retest of the 100-day MA which rests just below a key area of support at 5757 could become a real possibility.
S&P 500 Daily Chart, December 19, 2024
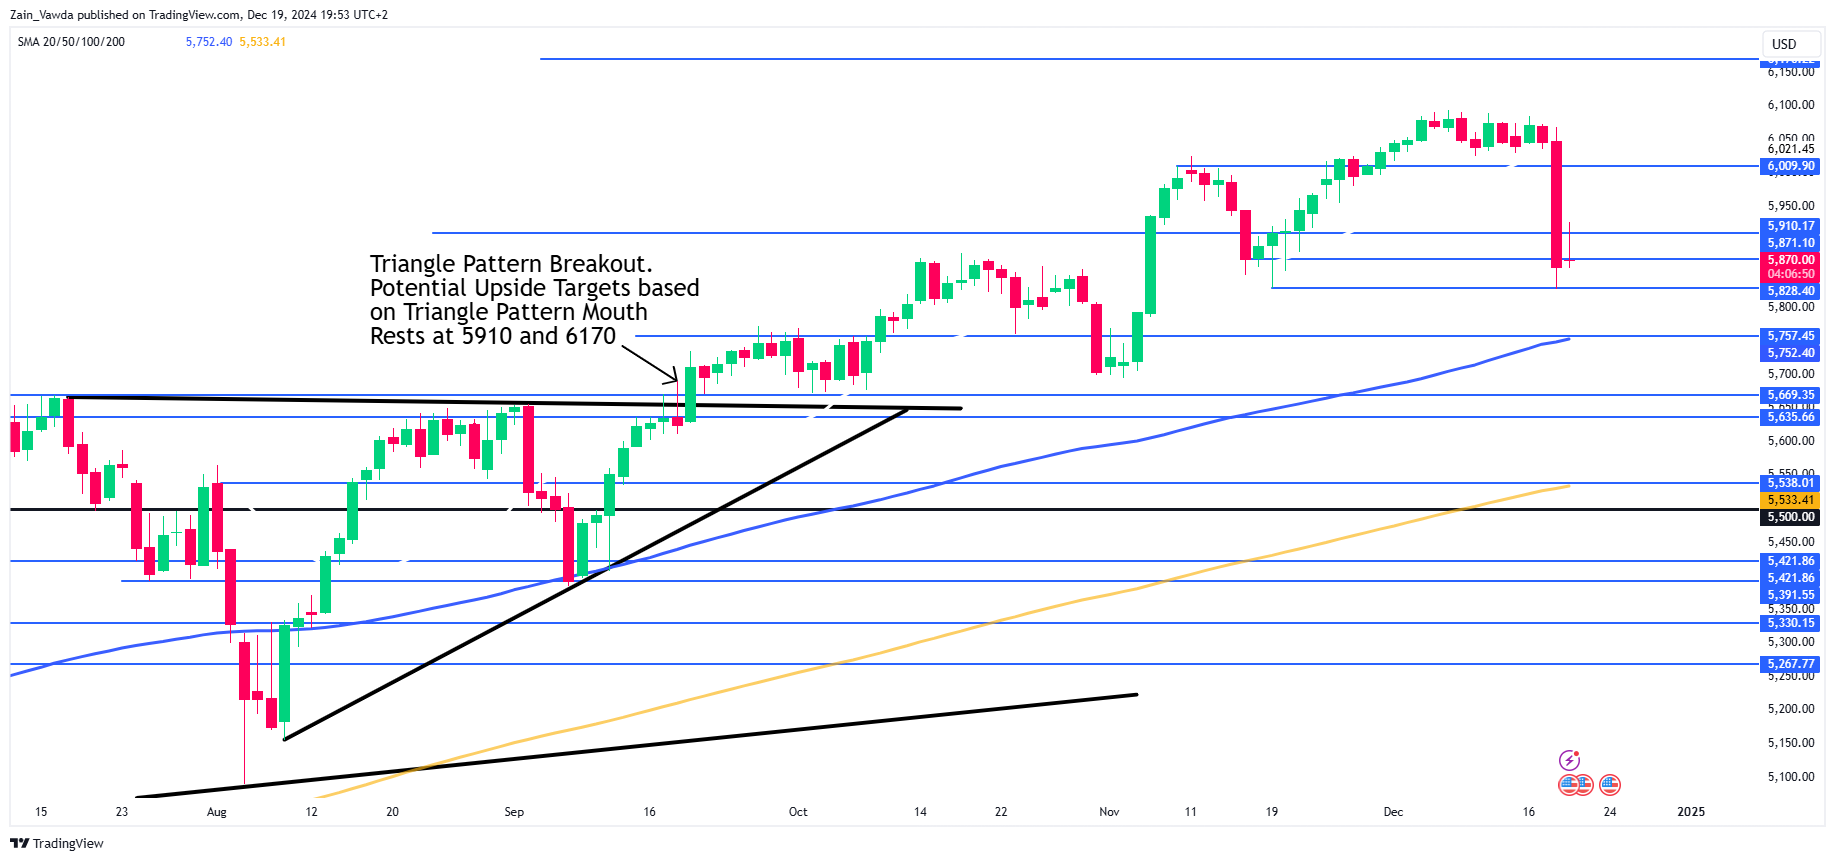
Support
- 5828
- 5757
- 5700
Resistance
- 5910
- 5950
- 6000
Author

Zain Vawda
MarketPulse
Zain is a seasoned financial markets analyst and educator with expertise in retail forex, economics, and market analysis.


