|

S&P 500 approaching the up trendline

It is fascinating that we are so close to the all-time highs percentages on indices giving us a sense of such a huge uncertainty on the market. With almost every tick down, sellers are celebrating the new bear market. Most of that is generally just wishing not trading and is mostly betting on possibility than probability, but we all know that in trading it’s the probability that wins.

With that being said, let’s talk a look on the SP500, trying to be as much objective as we can, taking into consideration only the chart and the story behind it. First thing you see is the rise from the end of the year, which ended with establishing the new all-time highs. Many will call it a Santa Rally and they will not be mistaken. We can see, that it allowed to break the crucial horizontal resistance around 4740 (orange). Just for a while though, which actually can be worrying as it makes a false bullish breakout (yellow). False breakout usually tends to give strong signals in the opposite direction, so in our case, to the downside.

Chart

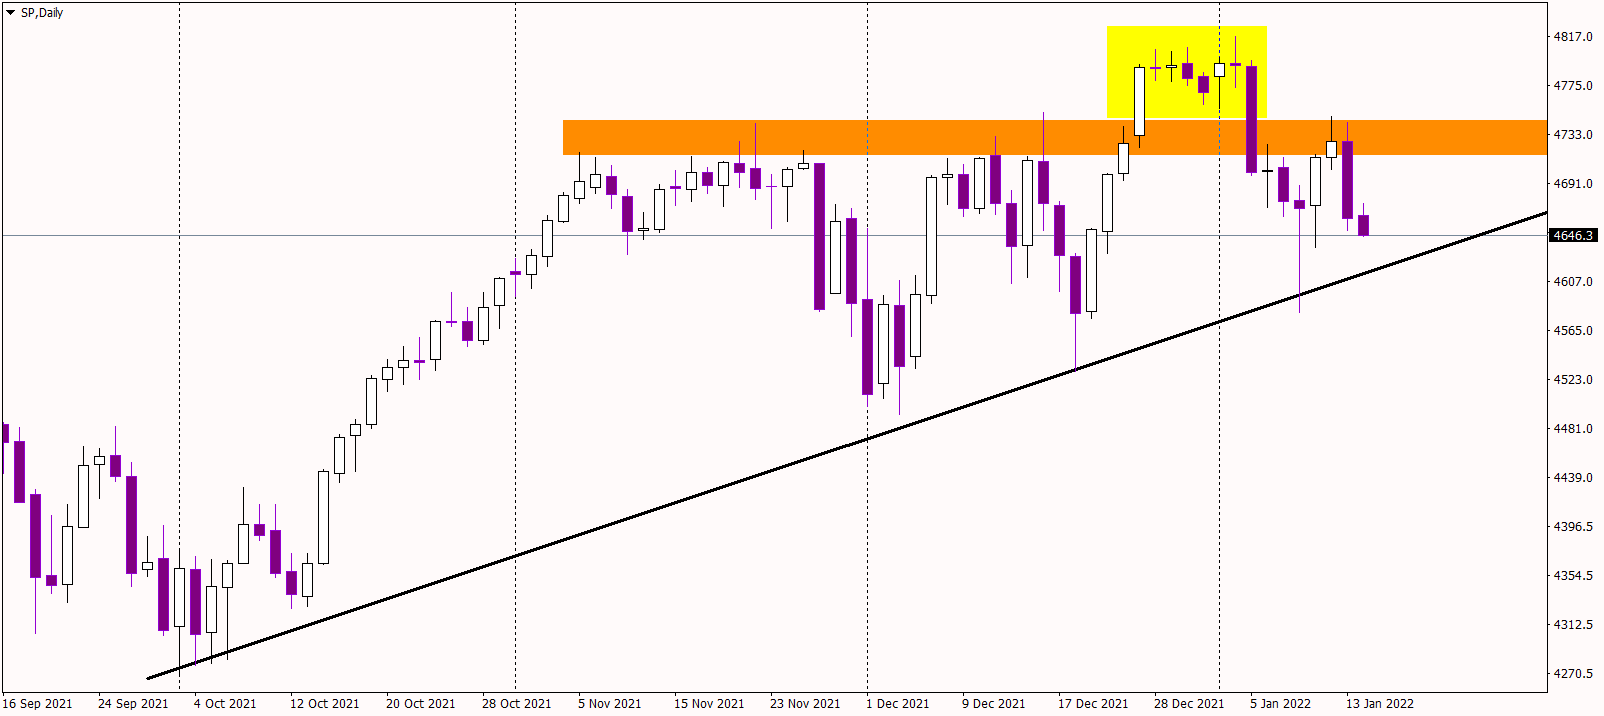
There is an important resistance (orange) but there is also a support. The crucial one is the dynamic up trendline (black), connecting most recent higher lows. It helped the buyers a few times and can help them again.

We are currently locked between the horizontal resistance from the top and the dynamic resistance from the bottom. As long as we stay between them, there is no clear trading signal. The breakout of the 4740 resistance, will give us another mid-term buy signal and the breakout of the up trendline, will give us a signal to sell, as for now, the best option seems to patiently wait.

Author

Tomasz Wisniewski

Tomasz Wisniewski

Axiory Global Ltd.

Tomasz was born in Warsaw, Poland on 25th October, 1985.

More from Tomasz Wisniewski
Share:

Editor's Picks

EUR/USD hits two-day highs near 1.1820

EUR/USD picks up pace and reaches two-day tops around 1.1820 at the end of the week. The pair’s move higher comes on the back of renewed weakness in the US Dollar amid growing talk that the Fed could deliver an interest rate cut as early as March. On the docket, the flash US Consumer Sentiment improves to 57.3 in February.

GBP/USD reclaims 1.3600 and above

GBP/USD reverses two straight days of losses, surpassing the key 1.3600 yardstick on Friday. Cable’s rebound comes as the Greenback slips away from two-week highs in response to some profit-taking mood and speculation of Fed rate cuts. In addition, hawkish comments from the BoE’s Pill are also collaborating with the quid’s improvement.

Gold climbs further, focus is back to 45,000

Gold regains upside traction and surpasses the $4,900 mark per troy ounce at the end of the week, shifting its attention to the critical $5,000 region. The move reflects a shift in risk sentiment, driving flows back towards traditional safe haven assets and supporting the yellow metal.

Crypto Today: Bitcoin, Ethereum, XRP rebound amid risk-off, $2.6 billion liquidation wave

Bitcoin edges up above $65,000 at the time of writing on Friday, as dust from the recent macro-triggered sell-off settles. The leading altcoin, Ethereum, hovers above $1,900, but resistance at $2,000 caps the upside. Meanwhile, Ripple has recorded the largest intraday jump among the three assets, up over 10% to $1.35.

Three scenarios for Japanese Yen ahead of snap election

The latest polls point to a dominant win for the ruling bloc at the upcoming Japanese snap election. The larger Sanae Takaichi’s mandate, the more investors fear faster implementation of tax cuts and spending plans. 

XRP rally extends as modest ETF inflows support recovery

Ripple is accelerating its recovery, trading above $1.36 at the time of writing on Friday, as investors adjust their positions following a turbulent week in the broader crypto market. The remittance token is up over 21% from its intraday low of $1.12.