S&P 500 update: these four indicators point towards a rally.

This article will cover several indicators we track for our premium members. These
indicators can help those who understand that “big time frames lead to big gains”
determine if a significant low has been struck.
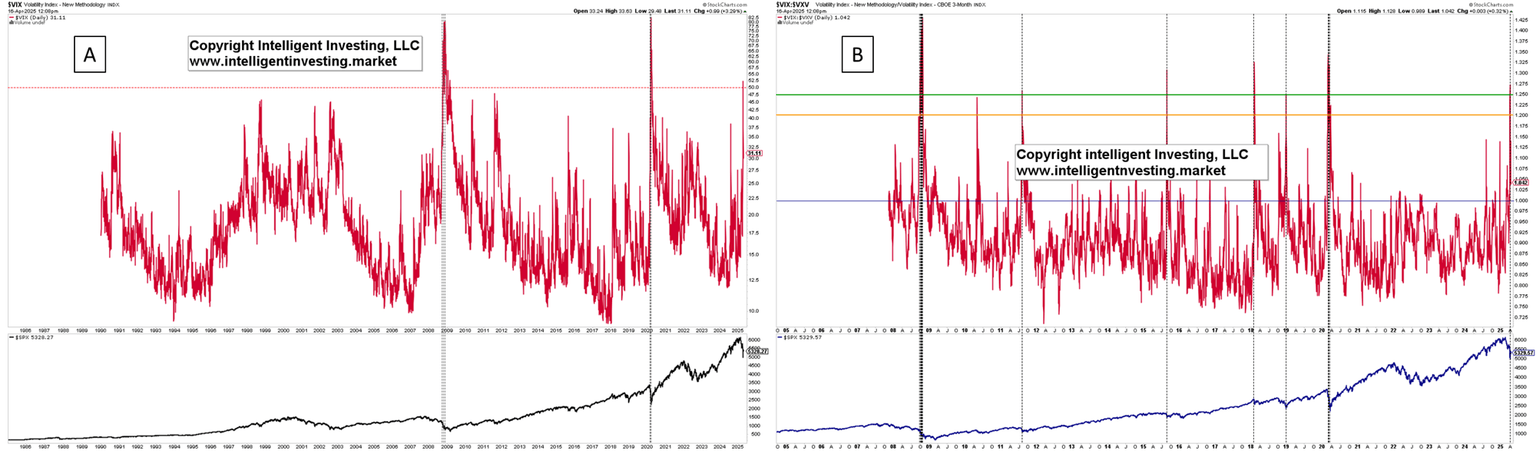
The Volatility Index (VIX), aka the “fear gauge,” which measures the market
expectations of 30-day volatility for the S&P500 (SPX), had its 3 rd highest reading in
early April (52.3) since data became available in 1989. See Figure 1A below. The two
prior occasions were during the 2008 bear market and the 2020 COVID-19 crash.
Besides, when we include the 3-month Volatility Index (VXV) and make a ratio
(VIX/VXV), we can identify more lows with spikes above 1.25. Earlier this month, the
ratio spiked to 1.274 and now sits at 1.028. Although not all occasions were “the low,” all
were excellent buying opportunities.
Figure 1. Volatility Index (VIX) (30 days) and the VIX/VXV (3 months out) ratio.
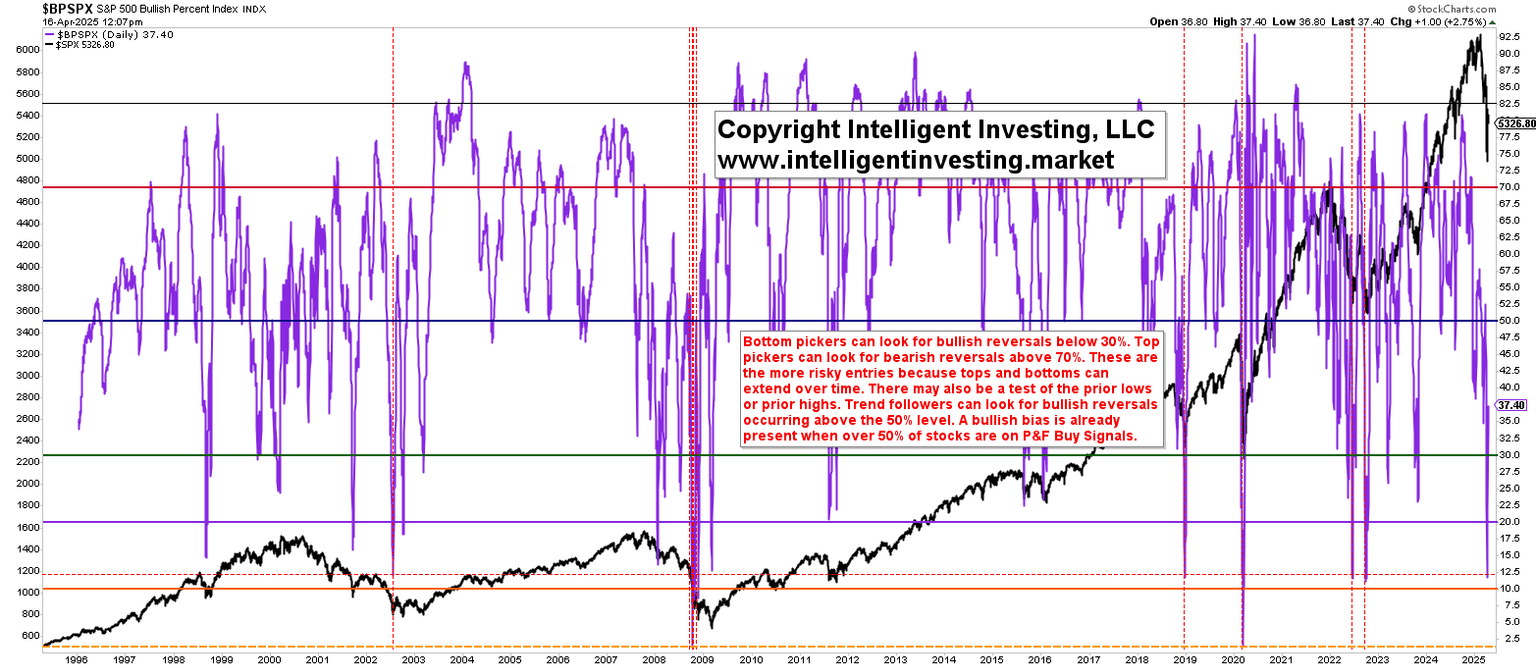
Next up is the Bullish Percent Index (BPI) for the SPX. The BPI tells us how many
individual stocks that comprise an index, such as the SPX, are on a buy signal (point-
and-figure chart). Aka, “it’s a market of stocks, not a stock market.” See Figure 2 below.
Earlier this month, the BPI dropped to as low as 11.80. That is as low as during the
2022 bear market, the 2020 flash crash, and the 2019 correction. Before that, only the
2008 bear market eclipsed that low a reading. All occasions were excellent buying
opportunities.
Figure 2: The Bullish Percent Index.
In one of our previous articles, we covered the 52-week New Lows (NYLOW) indicator
and found that although it had spiked to 1152 earlier this month, no new bear market
was identified. Besides, when we look at all instances when the NYLOW spiked over
1000 since 1965, we find that all but one (2007) were great long-term buying
opportunities: 1987, 1998, 2008, 2011, 2015, 2019, 2020, and 2022. See Figure 3
below.
Figure 3. The 52-week New Lows.

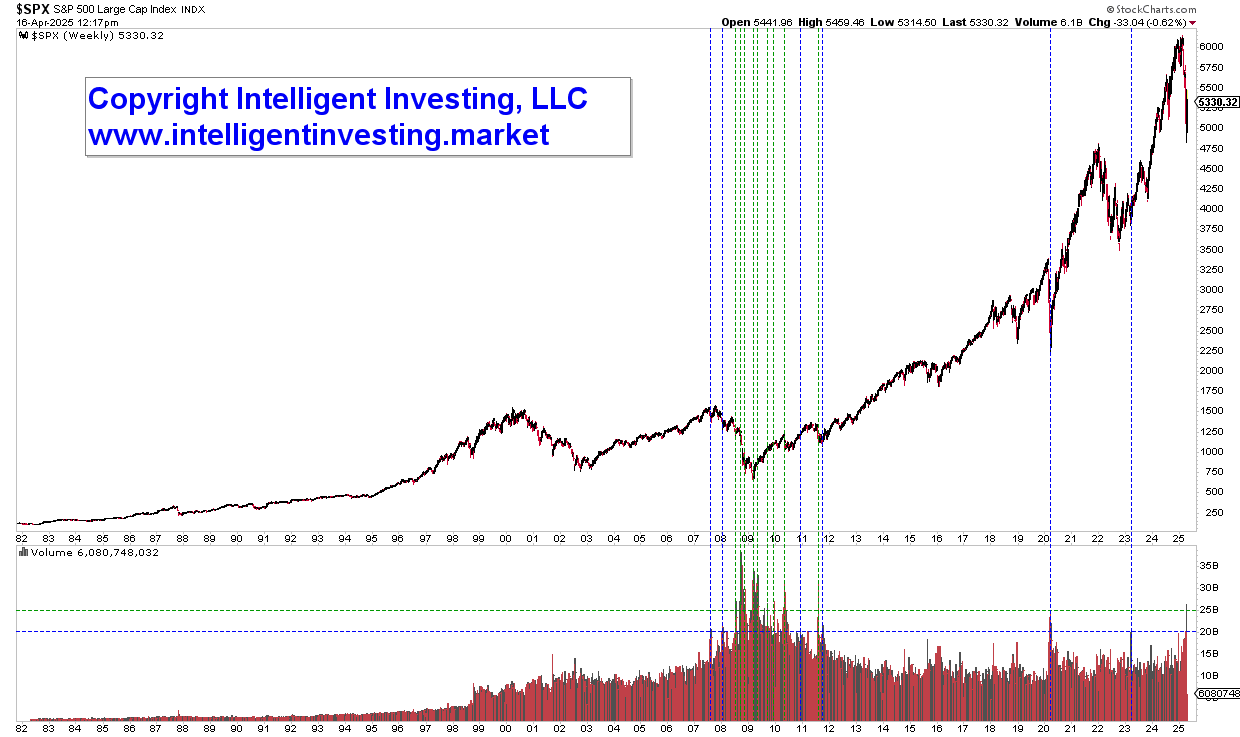
Speaking of spikes: During the recent “tariff crash,” the volume on the SPX spiked to
over 25 billion. See Figure 4 below. Such high spikes are rare: Since the early 1980s,
they have only occurred in 2011 and 2008-2010. Expanding it to 20 billion, we can
include early 2023, 2020, 2011, and 2007. Thus, high volume spikes occur only during
bear markets and at the start of new bull markets when smart money, i.e., large
institutions, are buying as they often have a long-term view.
Figure 4. Weekly Volume Spikes over 25 and 20 billion.
Author

Dr. Arnout Ter Schure
Intelligent Investing, LLC
After having worked for over ten years within the field of energy and the environment, Dr.


