|

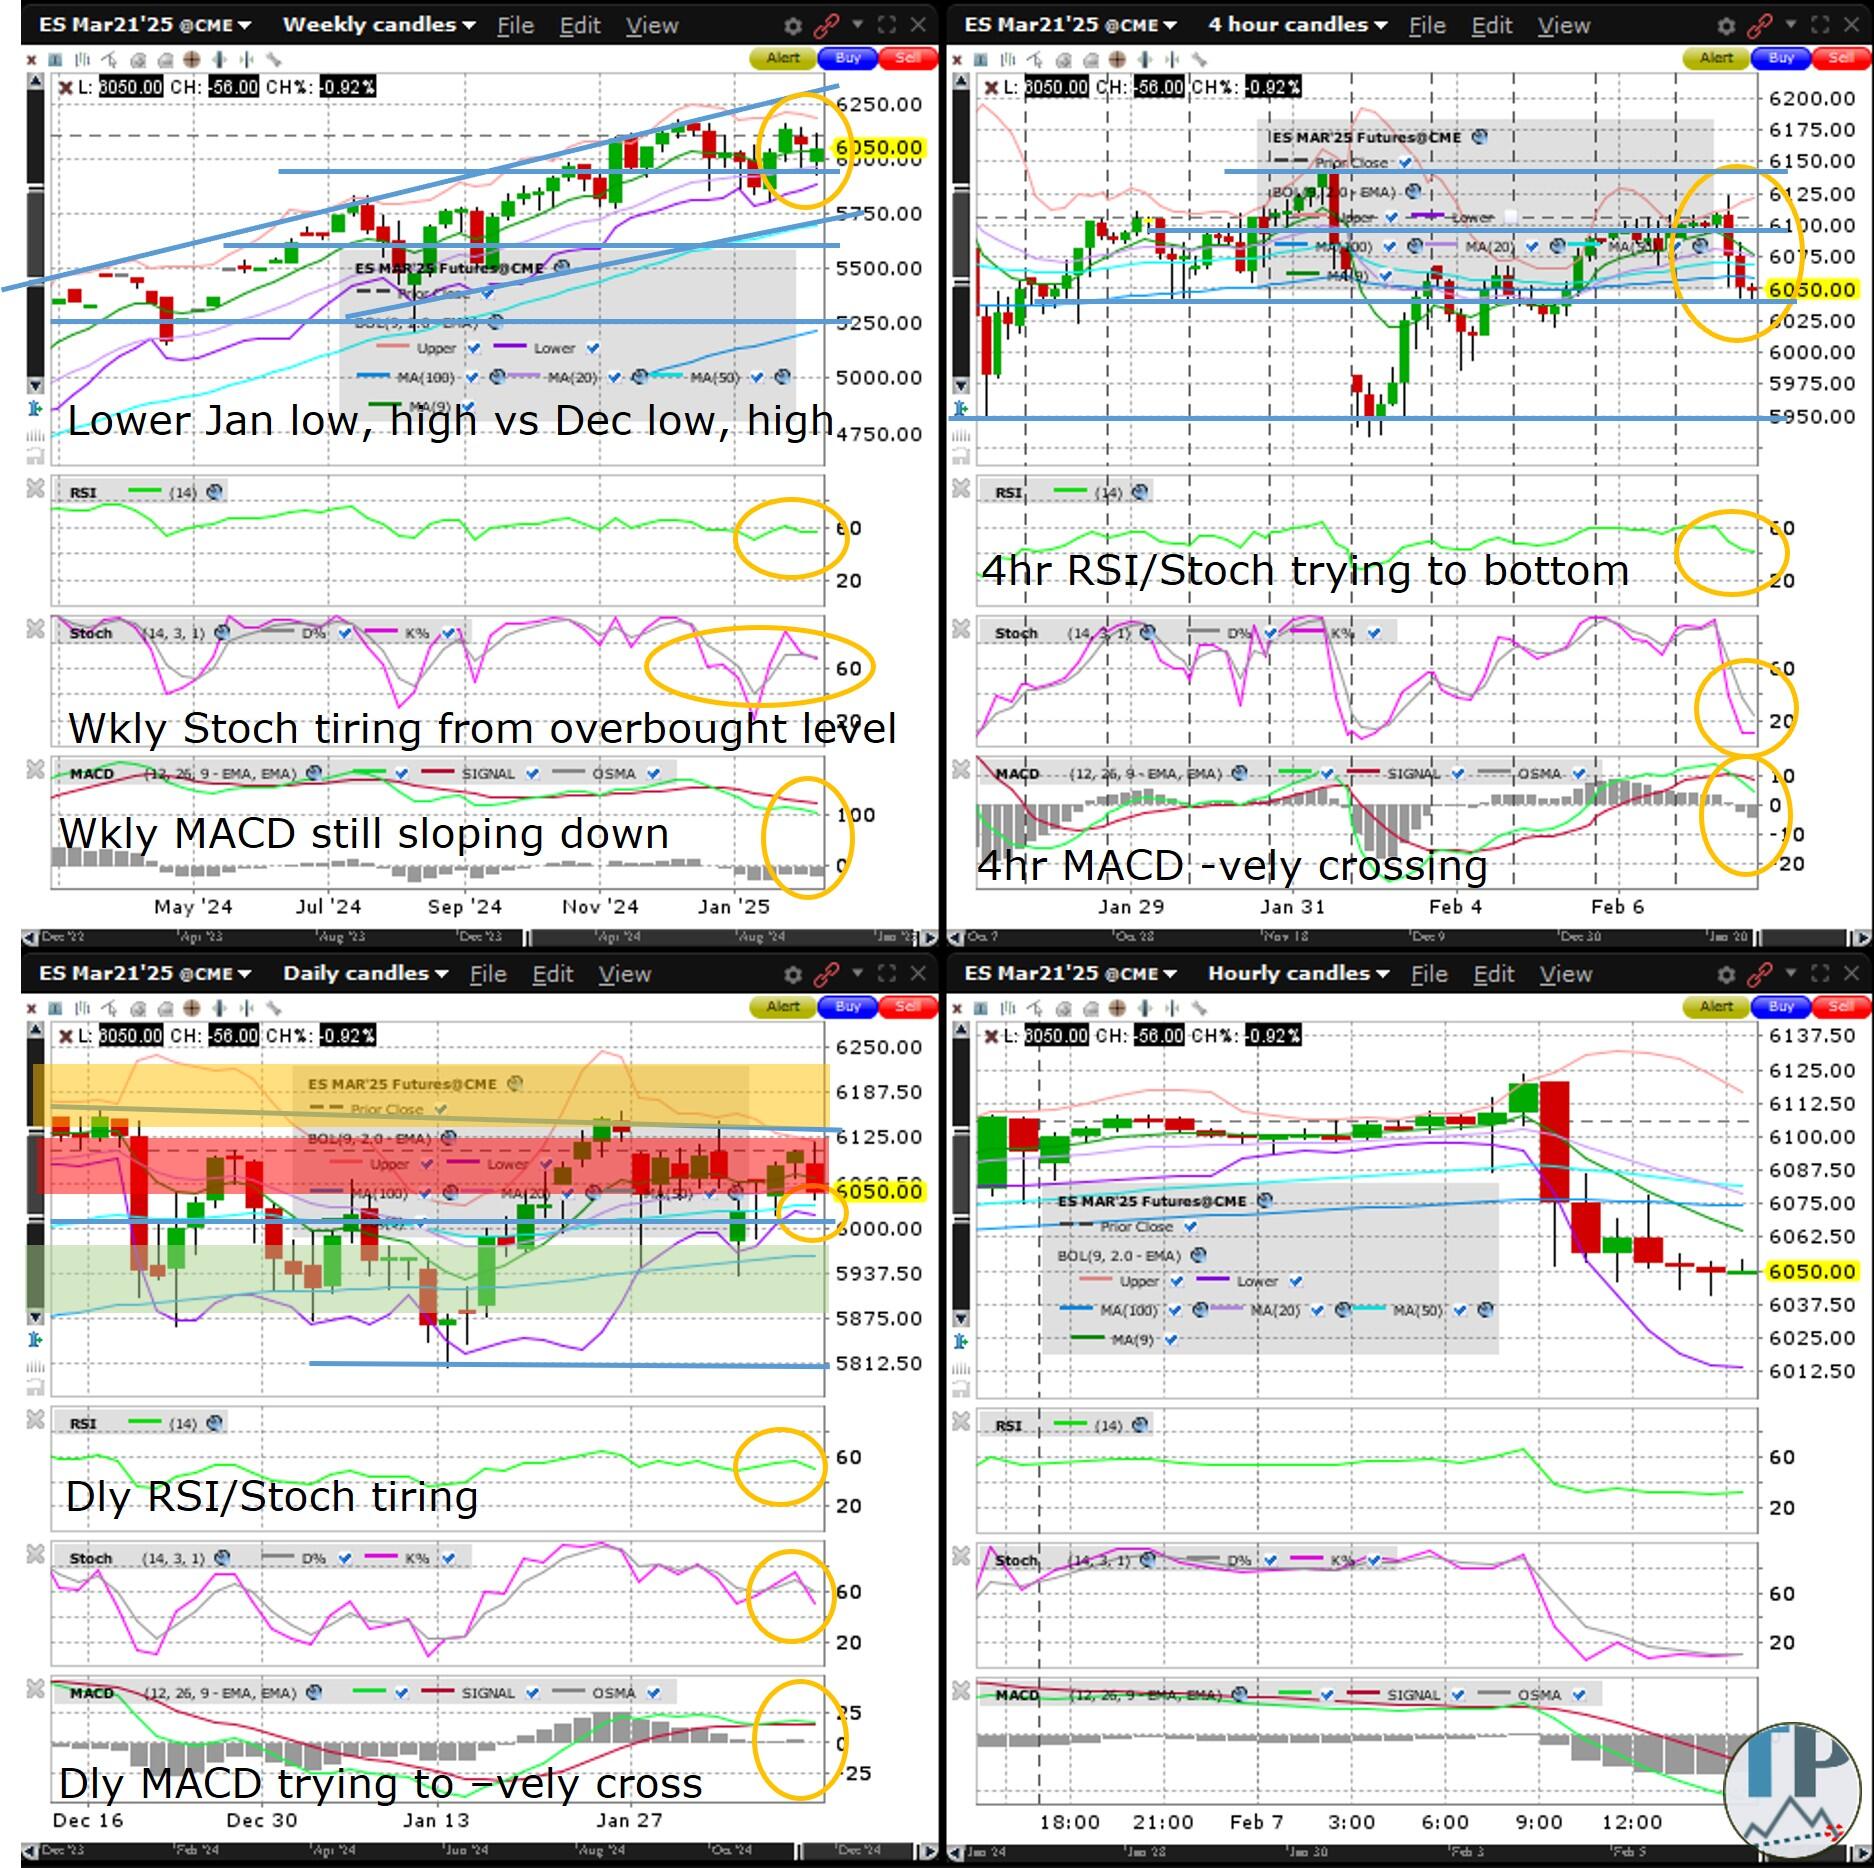
S&P 500 daily MACD tries negatively crossing

The S&P500 (ES) reversed more than a third of last week’s gains off its Monday low on Friday, and is vulnerable this week to a retest of last week’s low.  Before bears get excited, ES will need to break below the weekly chart upchannel support.  Nevertheless, the lower January low and high versus the December low and high are increasing chances that the powerful Bull Market extension from October 2022 may be exhausting.  The monthly MACD histogram on the continuous contract (as can be seen on tradingview.com) is steadily sloping down and weighing on the still slightly rising MACD blue line.  Volatility is likely to increase as early as Tuesday with the US Fed Chair Powell comments, and certainly by Wednesday with the US CPI and further Powell remarks.  Thursday, watch for the US PPI and unemployment claims, and on Friday for the US retail sales. The weekly and daily RSI, Stochastics and MACD are tiring or steadily sloping down.  I am looking to enter short in the red zone (of the daily chart), targeting the green zone for Friday.  The amber/yellow zone is where I might place a stop if I was a swing trader (although in my personal account with which I seldom hold overnight I sometimes set my stops tighter).

Weekly/Daily/4hr

Chart

Author

Darren Chu, CFA

Darren Chu, CFA

Tradable Patterns

Darren Chu, CFA, ex-Intercontinental Exchange | NYSE Liffe, TMX Group, CMC Markets, is the founder of Tradable Patterns – a publisher of futures/FX technical analysis on Bloomberg, LSEG (Refinitiv) and Factset.

More from Darren Chu, CFA
Share:

Markets move fast. We move first.

Orange Juice Newsletter brings you expert driven insights - not headlines. Every day on your inbox.

By subscribing you agree to our Terms and conditions.

Editor's Picks

EUR/USD trades with negative bias around 1.1730 amid recovering USD; downside seems limited

The EUR/USD pair kicks off the new week on a softer note, though it remains within striking distance of the highest level since early October, touched last Thursday. Spot prices currently trade around the 1.1730 region, down less than 0.10% for the day.

GBP/USD holds steady above mid-1.3300s as traders await key data and BoE this week

The GBP/USD pair remains on the defensive during the Asian session on Monday, though it lacks bearish conviction and holds above the 200-day Simple Moving Average pivotal support. Spot prices currently trade around the 1.3360 region, nearly unchanged for the day.

Gold regains traction toward $4,350 in the final full week of 2025

Gold price picks up bids once again toward $4,350 in Asian trading on Monday. The precious metal extends its upside to the highest since October 21 amid the prospect of interest rate cuts by the US Federal Reserve next year. The delayed US Nonfarm Payrolls report for October will be in the spotlight later on Tuesday. 

Week ahead: US NFP and CPI, BoE, ECB and BoJ mark a busy week

After Fed decision, dollar traders lock gaze on NFP and CPI data. Will the BoE deliver a dovish interest rate cut? ECB expected to reiterate “good place” mantra. Will a BoJ rate hike help the yen recover some of its massive losses?

Big week ends with big doubts

The S&P 500 continued to push higher yesterday as the US 2-year yield wavered around the 3.50% mark following a Federal Reserve (Fed) rate cut earlier this week that was ultimately perceived as not that hawkish after all. The cut is especially boosting the non-tech pockets of the market.

Aave Price Forecast: AAVE primed for breakout as bullish signals strengthen

Aave (AAVE) price is trading above $204 at the time of writing on Friday and approaching the upper boundary of its descending parallel channel; a breakout from this structure would favor the bulls.