Soybeans Elliott Wave technical analysis [Video]
![Soybeans Elliott Wave technical analysis [Video]](https://editorial.fxstreet.com/images/Markets/Commodities/Agriculture/soybean2-637443204454863145_XtraLarge.jpg)
Soybeans Elliott Wave analysis
After two weeks of little action, Soybean broke downside on 17 December. This marks the continuation of the bearish run that started in June 2022 when it exchanged for over $1785. The current price is around $950 with the potential for more fall toward 800 in the coming days or the next few weeks.
Daily chart analysis
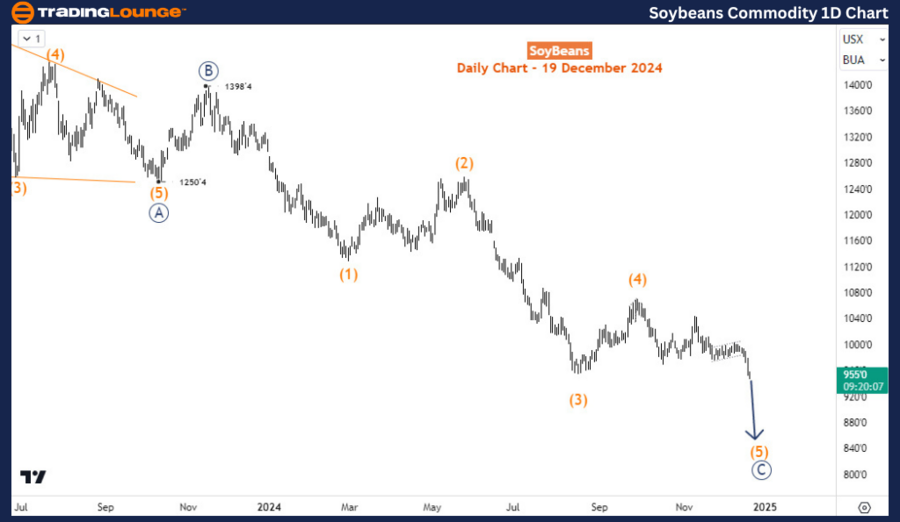
The daily chart shows Soybean bearish cycle from June 2022 is more of a correction than an impulse. Having completed wave ((A)) in October 2023 at 1250 and then a bounce for wave ((B)) which finished at 1398 in November 2023, wave ((C)) has progressed with an incomplete impulse structure but in the last wave - wave (5). It’s noteworthy that this bearish cycle from June 2022 is correcting the impulse wave bullish cycle that emerged in May 2019 and finished in June 2022.
Meanwhile, the H4 chart looks at the current position of wave (5) and how much lower it could extend.
Four-hour chart analysis
Along the path for wave (5), the price has completed waves 1 and 2 of (5) and is now in wave 3. Wave 3 is incomplete - currently in wave (iii) of ((iii)) of 3. This means there is still some way to go before wave (5) will complete. of course, we should take note of an alternative ending diagonal structure completing wave (5) instead of an impulse. In either case, the downside is favored in the short term. Thus, sellers should consider selling off bounces.
.png.0d7eb6c7f76270fbb55f4c904eb44c43.png)
Soybeans Elliott Wave technical analysis [Video]
Author

Peter Mathers
TradingLounge
Peter Mathers started actively trading in 1982. He began his career at Hoei and Shoin, a Japanese futures trading company.


