Soybeans Elliott Wave technical analysis [Video]
![Soybeans Elliott Wave technical analysis [Video]](https://editorial.fxstreet.com/images/Markets/Commodities/Agriculture/soybean3-637443204454550091_XtraLarge.jpg)
Soybean Elliott Wave overview
Soybean prices have fallen to their lowest point since September 2020, continuing a long-term downtrend that began in June 2022. The most recent decline started in May 2024, erasing the gains made between February and March 2024. Although a short-term corrective bounce is possible, the overall outlook suggests that the commodity will likely continue its downward trajectory over the next few months.
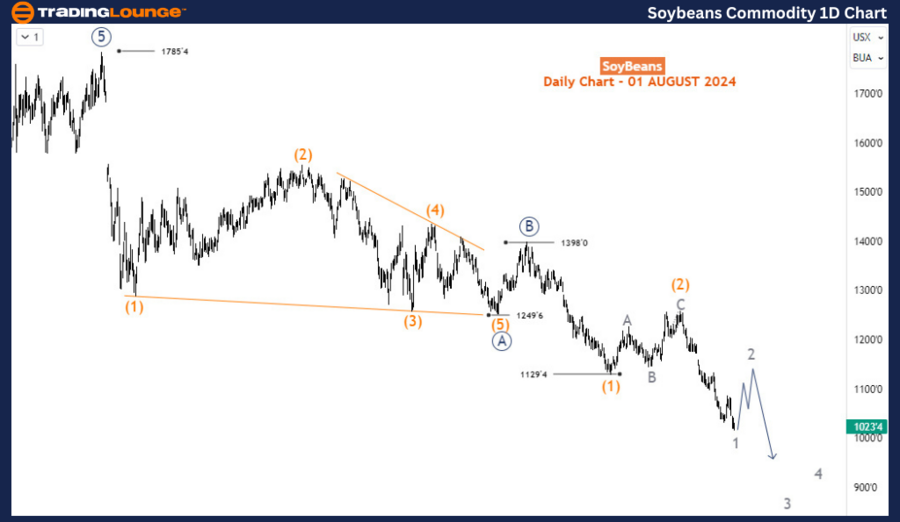
Daily chart analysis
On the daily chart, a significant bullish impulse wave, which began in May 2019, peaked at 1785 in June 2022. Since then, prices have entered a corrective phase, adjusting the long-term upward trend. This decline from the 1785 peak is a zigzag A-B-C (circled) pattern. Wave A and B (circled) were completed at 1249 (October 2023 low) and 1398 (November 2023 high), respectively. Wave C (circled) is now unfolding downward, with waves (1) and (2) of 5 (circled) already formed, and wave 1 of (3) currently in progress. The price is nearing the critical 1,000 level as it works to finalize wave 1 of (3). A corrective move for wave 2 of (3) is expected to start soon.
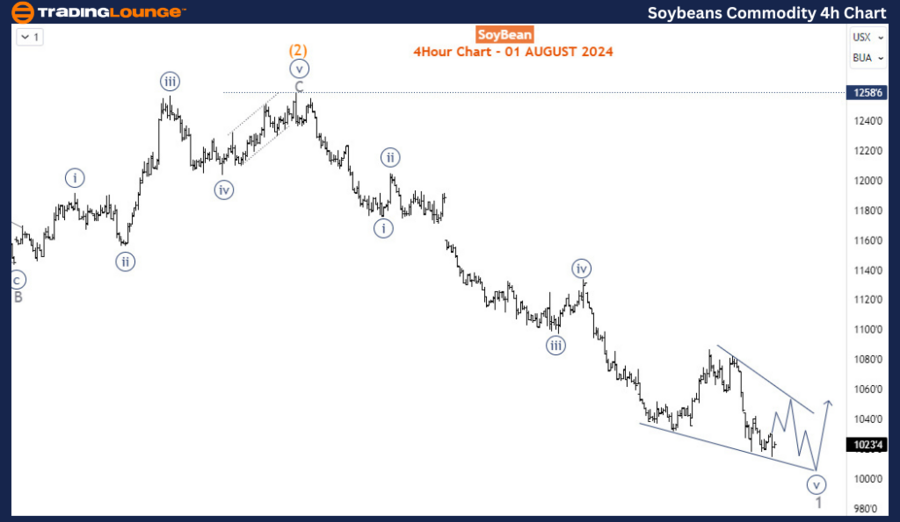
Four-hour chart analysis
On the H4 chart, wave 1 seems to be close to finishing an impulsive wave pattern, with the 5th sub-wave likely forming an ending diagonal that could signal a reversal. Before any significant movement occurs, a bullish confirmation for wave 2 is necessary. The ideal trading approach at this stage is to wait for wave 2 to complete, then look for SHORT opportunities as wave 3 of (3) begins, provided the 1288 wave (2) high remains unbroken.
Conclusion
In conclusion, the Elliott Wave analysis of soybeans indicates that while a brief corrective bounce may be on the horizon, the prevailing bearish trend is expected to persist. Traders should be vigilant for SHORT opportunities following the anticipated wave 2 correction, particularly around the key 1,000 level. The larger downtrend remains in place, and the completion of the current wave pattern will offer further guidance on the commodity's future direction.
Soybeans Elliott Wave technical analysis [Video]
Author

Peter Mathers
TradingLounge
Peter Mathers started actively trading in 1982. He began his career at Hoei and Shoin, a Japanese futures trading company.


