Soybeans Elliott Wave analysis

Function - Trend. 

Mode - Impulse. 

Structure - Impulse for wave (3).

Position - Wave 1 of (3).

Direction - Wave 1 of (3) is still in play.

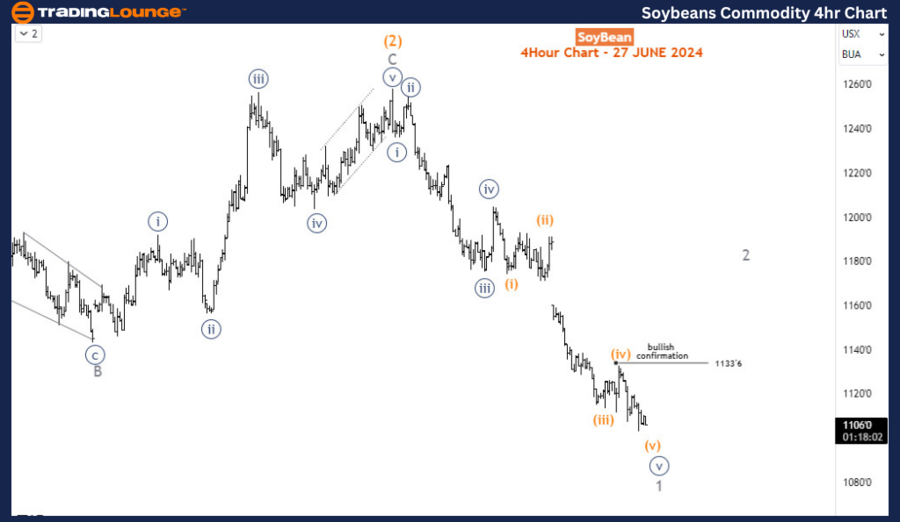
Details - Wave 1 extends lower. No signs of a bullish correction yet. Still anticipating wave 2 to begin but first confirmation is expected above 1133’6.

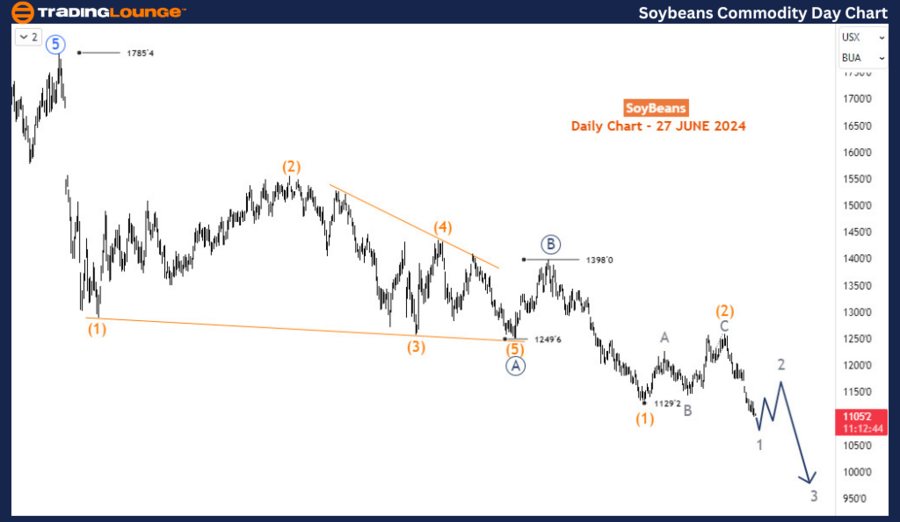
Since late May 2024, Soybean prices have declined by over 12%, resuming the long-term sell-off that began in June 2022. The price has retraced completely from the recovery phase between late February and May 2024, after breaking below 1129. This breakdown suggests that Soybean prices will likely continue to fall in the coming weeks. However, a rebound may occur soon to correct the current decline from May.

On the daily chart, the price is following an A-B-C (circled) pattern in the primary degree. Wave A started in June 2022 at 1785 and ended with a diagonal at 1249 in October 2023. Wave B then followed, finishing at 1398 in November 2023, marking the beginning of the current wave C. Since November 2023, Wave C has been developing into an impulse wave. Wave (1) of C was completed at 1129 in late February 2024, followed by a corrective bounce for wave (2) that reached 1258 in May 2024. From the May 2024 high, wave (3) has been unfolding and could extend to the 891-829 range. Currently, the price is nearing the completion of wave 1 of (3), and a pullback for wave 2 is expected to begin soon.

Soybean

On the H4 chart, wave 1 is finishing an impulse wave structure, though no reversal signs are present yet. The fifth sub-wave of wave 1 is also completing an impulse, indicating that wave 1 is close to completion. A corrective bounce for wave 2 is anticipated to emerge, especially if there is a bullish reaction above 1133. After wave 2 concludes, the dominant bearish trend is expected to resume with wave 3 of (3).

Soybean

Soybeans Elliott Wave technical analysis [Video]

As with any investment opportunity there is a risk of making losses on investments that Trading Lounge expresses opinions on.

Historical results are no guarantee of future returns. Some investments are inherently riskier than others. At worst, you could lose your entire investment. TradingLounge™ uses a range of technical analysis tools, software and basic fundamental analysis as well as economic forecasts aimed at minimizing the potential for loss.

The advice we provide through our TradingLounge™ websites and our TradingLounge™ Membership has been prepared without considering your objectives, financial situation or needs. Reliance on such advice, information or data is at your own risk. The decision to trade and the method of trading is for you alone to decide. This information is of a general nature only, so you should, before acting upon any of the information or advice provided by us, consider the appropriateness of the advice considering your own objectives, financial situation or needs. Therefore, you should consult your financial advisor or accountant to determine whether trading in securities and derivatives products is appropriate for you considering your financial circumstances.

Recommended Content


Recommended Content

Editors’ Picks

EUR/USD retreats to 1.0700 area following post-PCE jump

EUR/USD retreats to 1.0700 area following post-PCE jump

After spiking to a daily high of 1.0720 with the immediate reaction to US PCE inflation data, EUR/USD lost its traction and declined to the 1.0700 area. Investors remain cautious ahead of this weekend's French election and make it difficult for the Euro to gather strength.

EUR/USD News

GBP/USD stays below 1.2650 after US inflation data

GBP/USD stays below 1.2650 after US inflation data

GBP/USD struggles to preserve its bullish momentum and trades below 1.2650 in the American session on Friday. Earlier in the day, the data from the US showed that the annual core PCE inflation declined to 2.6% in May, limiting the USD's upside and helping the pair hold its ground.

GBP/USD News

Gold keeps its daily gains near $2,330 following US PCE data

Gold keeps its daily gains near $2,330 following US PCE data

Gold prices maintain their constructive bias around $2,330 after US inflation readings gauged by the PCE matched consensus in May and US yields advance slightly across the curve.

Gold News

BTC struggles around the $62,000 level

BTC struggles around the $62,000 level

Bitcoin price faces pullback resistance at the lower band of the descending wedge around $62,000. Ethereum price finds support at $3,288, the 61.8% Fibonacci retracement level. Ripple price faces resistance at $0.500, its daily resistance level.

Read more

French Elections Preview: Euro to suffer after the calm, as specter of extremists, uncertainty rise Premium

French Elections Preview: Euro to suffer after the calm, as specter of extremists, uncertainty rise

The first round of French parliamentary elections is set to trigger high uncertainty. Soothing messages from the far right and far left leave the Euro vulnerable to falls. Calm may return only after the second round of voting on  July 7.

Read more

Majors

Cryptocurrencies

Signatures